LGA
Sequence Independent Analysis (LGA)
Frame of reference: Cat.Q2246_545_130.5wLII_11077_46
Total number of 3D structures: 57
LGA calculations using distance cutoff DIST: 4.0 A
Residues superimposed below 2.00 A: GREEN
Residues superimposed below 4.00 A: YELLOW
Residues superimposed below 6.00 A: ORANGE
Residues superimposed below 8.00 A: BROWN
Residues superimposed above 8.00 A or not aligned: RED
Terminal residues not aligned: GREY
Structure Deviation Summary
Calculations based on one final LGA superposition
(Bar representation of 3D plots, TEXT)
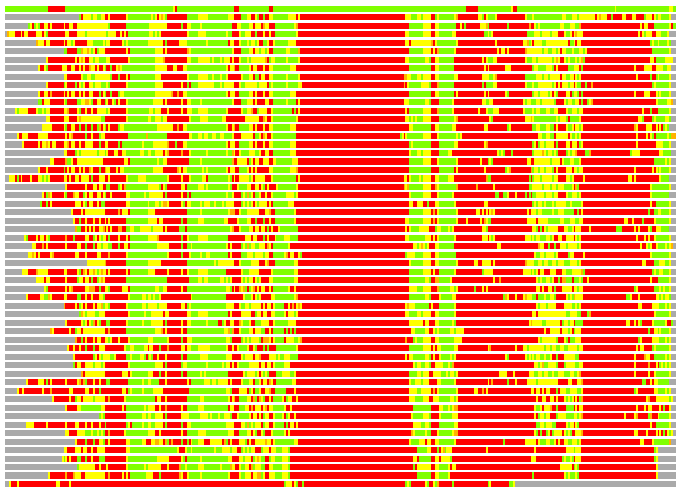
Structures ordered by LGA_S - score
| Structure |
NS |
NT |
N(dist=4.0) |
RMSD(N) |
Seq_ID(N) |
LGA_S |
LGA_Q |
PLOTS |
| 1zkd_A |
357 |
343 |
320 |
0.58 |
29.69 |
92.683 |
47.276 |
T P |
| 1ri5_A |
252 |
343 |
173 |
2.22 |
13.29 |
33.405 |
7.461 |
T P |
| 2o57_A |
282 |
343 |
167 |
2.26 |
13.77 |
33.044 |
7.071 |
T P |
| 2ex4_A |
221 |
343 |
164 |
2.35 |
14.63 |
31.641 |
6.686 |
T P |
| 1im8_A |
225 |
343 |
161 |
2.32 |
11.18 |
31.305 |
6.664 |
T P |
| 3d2l_C |
242 |
343 |
152 |
2.13 |
10.53 |
31.111 |
6.813 |
T P |
| 1xva_A |
292 |
343 |
158 |
2.22 |
10.76 |
30.818 |
6.804 |
T P |
| 1jqd_B |
288 |
343 |
152 |
2.18 |
13.16 |
30.739 |
6.664 |
T P |
| 3bxo_A |
236 |
343 |
154 |
2.25 |
12.99 |
30.735 |
6.559 |
T P |
| 1d2g_A |
292 |
343 |
159 |
2.23 |
10.69 |
30.733 |
6.826 |
T P |
| 2aot_A |
288 |
343 |
151 |
2.22 |
12.58 |
30.690 |
6.512 |
T P |
| 1wzn_A |
244 |
343 |
155 |
2.14 |
8.39 |
30.585 |
6.915 |
T P |
| 3e8s_A |
220 |
343 |
158 |
2.26 |
15.82 |
30.305 |
6.698 |
T P |
| 3dli_A |
221 |
343 |
148 |
2.22 |
11.49 |
29.748 |
6.387 |
T P |
| 1jqe_A |
280 |
343 |
150 |
2.27 |
12.00 |
29.717 |
6.334 |
T P |
| 2pxx_A |
213 |
343 |
146 |
2.14 |
17.12 |
29.701 |
6.526 |
T P |
| 2aou_B |
289 |
343 |
146 |
2.31 |
13.01 |
29.326 |
6.061 |
T P |
| 2yqz_A |
261 |
343 |
150 |
2.36 |
9.33 |
29.317 |
6.088 |
T P |
| 3bus_A |
251 |
343 |
148 |
2.26 |
10.14 |
29.265 |
6.261 |
T P |
| 2aot_B |
288 |
343 |
142 |
2.23 |
14.08 |
29.260 |
6.086 |
T P |
| 1qzz_A |
340 |
343 |
150 |
2.37 |
14.67 |
29.068 |
6.069 |
T P |
| 3dtn_A |
220 |
343 |
143 |
2.23 |
12.59 |
28.980 |
6.139 |
T P |
| 1ve3_B |
226 |
343 |
145 |
2.26 |
10.34 |
28.891 |
6.155 |
T P |
| 3dh0_B |
190 |
343 |
139 |
2.20 |
9.35 |
28.836 |
6.040 |
T P |
| 1xxl_A |
234 |
343 |
143 |
2.31 |
9.09 |
28.662 |
5.933 |
T P |
| 3bkw_A |
219 |
343 |
140 |
2.16 |
8.57 |
28.297 |
6.204 |
T P |
| 2gh1_A |
281 |
343 |
141 |
2.36 |
12.77 |
28.080 |
5.738 |
T P |
| 3e23_A |
198 |
343 |
142 |
2.23 |
12.68 |
27.922 |
6.096 |
T P |
| 1p91_A |
268 |
343 |
135 |
2.30 |
12.59 |
27.890 |
5.624 |
T P |
| 2pjd_A |
334 |
343 |
134 |
2.19 |
14.93 |
27.888 |
5.848 |
T P |
| 1vl5_A |
231 |
343 |
147 |
2.40 |
9.52 |
27.867 |
5.878 |
T P |
| 2avn_A |
247 |
343 |
146 |
2.36 |
12.33 |
27.733 |
5.941 |
T P |
| 3dlc_A |
219 |
343 |
135 |
2.19 |
11.11 |
27.664 |
5.900 |
T P |
| 3e7p_A |
253 |
343 |
134 |
2.36 |
10.45 |
27.540 |
5.445 |
T P |
| 1vlm_A |
207 |
343 |
134 |
2.24 |
11.19 |
27.481 |
5.730 |
T P |
| 1t43_A |
274 |
343 |
138 |
2.36 |
12.32 |
27.342 |
5.603 |
T P |
| 3cgg_A |
186 |
343 |
137 |
2.27 |
16.79 |
26.883 |
5.771 |
T P |
| 3ege_A |
247 |
343 |
137 |
2.27 |
9.49 |
26.865 |
5.791 |
T P |
| 1zq9_A |
278 |
343 |
135 |
2.23 |
13.33 |
26.809 |
5.789 |
T P |
| 2b3t_A |
276 |
343 |
138 |
2.36 |
10.87 |
26.570 |
5.606 |
T P |
| 3g5l_A |
222 |
343 |
139 |
2.33 |
10.07 |
26.510 |
5.716 |
T P |
| 2p8j_B |
207 |
343 |
135 |
2.23 |
8.89 |
26.428 |
5.792 |
T P |
| 1i9g_A |
264 |
343 |
132 |
2.33 |
14.39 |
26.303 |
5.427 |
T P |
| 3ccf_B |
242 |
343 |
138 |
2.28 |
10.87 |
26.279 |
5.807 |
T P |
| 2gs9_A |
211 |
343 |
132 |
2.38 |
13.64 |
25.893 |
5.316 |
T P |
| 3f4k_A |
254 |
343 |
129 |
2.40 |
9.30 |
25.733 |
5.165 |
T P |
| 2h1r_B |
275 |
343 |
130 |
2.29 |
11.54 |
25.510 |
5.440 |
T P |
| 1uwv_A |
417 |
343 |
120 |
2.26 |
8.33 |
25.174 |
5.080 |
T P |
| 1yb2_A |
230 |
343 |
124 |
2.22 |
13.71 |
25.112 |
5.346 |
T P |
| 3dmg_A |
371 |
343 |
123 |
2.26 |
15.45 |
25.102 |
5.208 |
T P |
| 2bh2_A |
418 |
343 |
126 |
2.30 |
7.94 |
25.016 |
5.247 |
T P |
| 3cc8_A |
211 |
343 |
129 |
2.48 |
9.30 |
23.515 |
4.999 |
T P |
| 1r18_A |
223 |
343 |
113 |
2.34 |
16.81 |
23.204 |
4.634 |
T P |
| 2yxe_A |
214 |
343 |
111 |
2.26 |
11.71 |
22.233 |
4.699 |
T P |
| 1dl5_A |
317 |
343 |
110 |
2.36 |
12.73 |
21.261 |
4.478 |
T P |
| 1jg1_A |
215 |
343 |
104 |
2.28 |
15.38 |
21.037 |
4.378 |
T P |
| 2o6p_A |
123 |
343 |
26 |
2.58 |
0.00 |
5.556 |
0.970 |
T P |
NS : Total number of residues in Structure (rotated structure)
NT : Total number of residues in TARGET (frame of reference)
N : Total number of residues superimposed under 4.0 Angstrom distance cutoff
RMSD : RMS deviation calculated on all N residues superimposed under 4.0 Angstrom distance cutoff
Seq_Id : Sequence Identity. Percent of identical residues from the total of N aligned.
LGA_S : Structure similarity score calculated by internal LGA procedure (see LGA paper for details)
LGA_Q : Score (how tight is the superposition) calculated by the formula: Q = 0.1*N/(0.1+RMSD)
PLOTS : T - Flat text file (output from LGA program, rotated structure)
PLOTS : P - Plot of superimposed structures (3D plot colored as bars)
Citing LGA:
Zemla A., "LGA - a Method for Finding 3D Similarities in Protein Structures",
Nucleic Acids Research, 2003, Vol. 31, No. 13, pp. 3370-3374.
[MEDLINE]