LGA
Sequence Independent Analysis (LGA)
Frame of reference: Cat.Q2246_545_137.5wLII_11111_10
Total number of 3D structures: 36
LGA calculations using distance cutoff DIST: 4.0 A
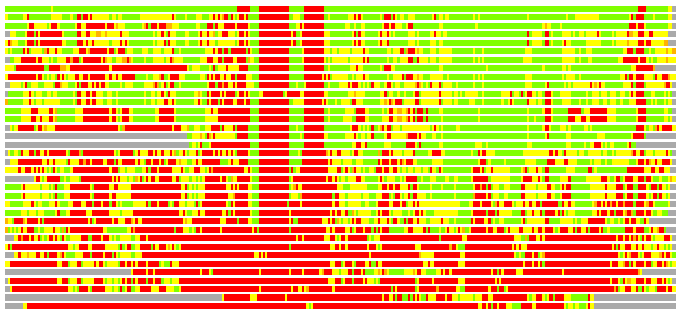
Residues superimposed below 2.00 A: GREEN
Residues superimposed below 4.00 A: YELLOW
Residues superimposed below 6.00 A: ORANGE
Residues superimposed below 8.00 A: BROWN
Residues superimposed above 8.00 A or not aligned: RED
Terminal residues not aligned: GREY
Structure Deviation Summary
Calculations based on one final LGA superposition
(Bar representation of 3D plots, TEXT)

Structures ordered by LGA_S - score
| Structure |
NS |
NT |
N(dist=4.0) |
RMSD(N) |
Seq_ID(N) |
LGA_S |
LGA_Q |
PLOTS |
| 2jjm_A |
359 |
309 |
275 |
0.45 |
20.00 |
88.924 |
50.002 |
T P |
| 3c4v_A |
393 |
309 |
258 |
1.91 |
15.50 |
71.207 |
12.865 |
T P |
| 2gek_A |
361 |
309 |
232 |
1.86 |
11.21 |
62.021 |
11.866 |
T P |
| 2iw1_A |
370 |
309 |
234 |
2.24 |
13.25 |
57.369 |
10.007 |
T P |
| 2iv7_A |
370 |
309 |
238 |
2.24 |
13.03 |
57.149 |
10.191 |
T P |
| 2qzs_A |
477 |
309 |
239 |
2.14 |
14.23 |
56.409 |
10.646 |
T P |
| 1rzu_B |
478 |
309 |
231 |
2.28 |
11.26 |
56.065 |
9.696 |
T P |
| 3c48_A |
399 |
309 |
188 |
1.75 |
17.02 |
54.931 |
10.175 |
T P |
| 1rzv_A |
477 |
309 |
217 |
2.13 |
9.68 |
53.997 |
9.711 |
T P |
| 2bis_A |
440 |
309 |
237 |
2.30 |
14.77 |
53.659 |
9.874 |
T P |
| 1gz5_A |
456 |
309 |
245 |
2.17 |
6.12 |
53.176 |
10.771 |
T P |
| 1uqt_A |
452 |
309 |
241 |
2.19 |
7.88 |
52.411 |
10.544 |
T P |
| 2iv3_C |
340 |
309 |
207 |
1.94 |
8.70 |
50.322 |
10.151 |
T P |
| 2iuy_A |
340 |
309 |
209 |
1.98 |
8.61 |
50.102 |
10.057 |
T P |
| 2r60_A |
456 |
309 |
190 |
2.06 |
9.47 |
49.657 |
8.792 |
T P |
| 2bfw_A |
196 |
309 |
167 |
1.96 |
12.57 |
46.197 |
8.116 |
T P |
| 2f9f_A |
166 |
309 |
152 |
1.58 |
9.21 |
45.099 |
9.035 |
T P |
| 2vsy_A |
547 |
309 |
197 |
2.53 |
9.64 |
41.332 |
7.494 |
T P |
| 2vsn_A |
534 |
309 |
192 |
2.41 |
8.33 |
40.579 |
7.637 |
T P |
| 1f0k_A |
351 |
309 |
185 |
2.34 |
10.27 |
38.406 |
7.573 |
T P |
| 3beo_A |
375 |
309 |
177 |
2.45 |
14.12 |
38.320 |
6.937 |
T P |
| 1f6d_A |
376 |
309 |
180 |
2.45 |
9.44 |
37.328 |
7.060 |
T P |
| 1vgv_A |
376 |
309 |
180 |
2.46 |
8.33 |
37.311 |
7.031 |
T P |
| 3dzc_A |
373 |
309 |
172 |
2.51 |
5.81 |
34.861 |
6.590 |
T P |
| 1o6c_B |
371 |
309 |
169 |
2.51 |
9.47 |
34.432 |
6.465 |
T P |
| 2iyf_B |
394 |
309 |
150 |
2.59 |
12.00 |
30.482 |
5.569 |
T P |
| 1v4v_A |
373 |
309 |
137 |
2.51 |
8.76 |
29.008 |
5.249 |
T P |
| 1f3w_A |
519 |
309 |
81 |
2.73 |
2.47 |
15.893 |
2.858 |
T P |
| 1pkm_A |
519 |
309 |
73 |
2.67 |
5.48 |
15.221 |
2.634 |
T P |
| 2g50_D |
521 |
309 |
77 |
2.81 |
5.19 |
15.073 |
2.649 |
T P |
| 1f3x_A |
519 |
309 |
73 |
2.79 |
6.85 |
14.894 |
2.527 |
T P |
| 1a05_A |
357 |
309 |
63 |
2.65 |
7.94 |
14.705 |
2.293 |
T P |
| 1pkn_A |
514 |
309 |
72 |
2.80 |
5.56 |
14.505 |
2.482 |
T P |
| 1a49_A |
519 |
309 |
68 |
2.65 |
5.88 |
14.488 |
2.477 |
T P |
| 1zy8_A |
474 |
309 |
59 |
2.53 |
8.47 |
12.636 |
2.241 |
T P |
| 1zmd_E |
473 |
309 |
32 |
2.46 |
3.12 |
7.105 |
1.248 |
T P |
NS : Total number of residues in Structure (rotated structure)
NT : Total number of residues in TARGET (frame of reference)
N : Total number of residues superimposed under 4.0 Angstrom distance cutoff
RMSD : RMS deviation calculated on all N residues superimposed under 4.0 Angstrom distance cutoff
Seq_Id : Sequence Identity. Percent of identical residues from the total of N aligned.
LGA_S : Structure similarity score calculated by internal LGA procedure (see LGA paper for details)
LGA_Q : Score (how tight is the superposition) calculated by the formula: Q = 0.1*N/(0.1+RMSD)
PLOTS : T - Flat text file (output from LGA program, rotated structure)
PLOTS : P - Plot of superimposed structures (3D plot colored as bars)
Citing LGA:
Zemla A., "LGA - a Method for Finding 3D Similarities in Protein Structures",
Nucleic Acids Research, 2003, Vol. 31, No. 13, pp. 3370-3374.
[MEDLINE]

