LGA
Sequence Independent Analysis (LGA)
Frame of reference: Cat.Q2246_545_144.5wLII_11111_45
Total number of 3D structures: 36
LGA calculations using distance cutoff DIST: 4.0 A
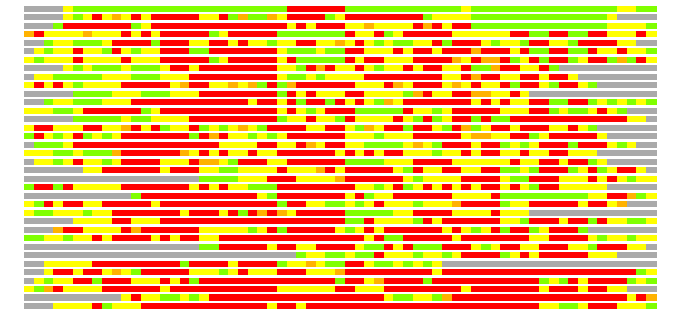
Residues superimposed below 2.00 A: GREEN
Residues superimposed below 4.00 A: YELLOW
Residues superimposed below 6.00 A: ORANGE
Residues superimposed below 8.00 A: BROWN
Residues superimposed above 8.00 A or not aligned: RED
Terminal residues not aligned: GREY
Structure Deviation Summary
Calculations based on one final LGA superposition
(Bar representation of 3D plots, TEXT)

Structures ordered by LGA_S - score
| Structure |
NS |
NT |
N(dist=4.0) |
RMSD(N) |
Seq_ID(N) |
LGA_S |
LGA_Q |
PLOTS |
| 3cjt_A |
254 |
65 |
55 |
0.98 |
32.73 |
83.050 |
5.081 |
T P |
| 1odu_B |
424 |
65 |
37 |
2.42 |
0.00 |
42.423 |
1.470 |
T P |
| 1kfq_A |
571 |
65 |
33 |
2.33 |
0.00 |
39.501 |
1.360 |
T P |
| 1po0_A |
661 |
65 |
38 |
2.62 |
10.53 |
39.103 |
1.400 |
T P |
| 1xkh_A |
687 |
65 |
38 |
2.57 |
10.53 |
38.901 |
1.424 |
T P |
| 1kmo_A |
661 |
65 |
36 |
2.57 |
5.56 |
37.338 |
1.350 |
T P |
| 1kmp_A |
647 |
65 |
37 |
2.69 |
8.11 |
36.943 |
1.325 |
T P |
| 1qj8_A |
148 |
65 |
31 |
2.70 |
9.68 |
34.471 |
1.108 |
T P |
| 2r4p_A |
418 |
65 |
32 |
2.76 |
0.00 |
34.360 |
1.117 |
T P |
| 1t16_A |
427 |
65 |
33 |
2.97 |
6.06 |
33.781 |
1.074 |
T P |
| 2vdf_A |
225 |
65 |
31 |
2.68 |
3.23 |
33.715 |
1.116 |
T P |
| 1fcp_A |
705 |
65 |
31 |
2.54 |
3.23 |
33.638 |
1.173 |
T P |
| 2ixx_A |
354 |
65 |
31 |
2.48 |
16.13 |
33.500 |
1.200 |
T P |
| 1p4t_A |
156 |
65 |
31 |
2.54 |
0.00 |
33.232 |
1.173 |
T P |
| 3dwo_X |
444 |
65 |
35 |
2.79 |
2.86 |
33.088 |
1.212 |
T P |
| 3bry_A |
389 |
65 |
31 |
2.71 |
6.45 |
32.835 |
1.104 |
T P |
| 2r4o_A |
421 |
65 |
31 |
2.55 |
0.00 |
32.494 |
1.169 |
T P |
| 2r4n_A |
421 |
65 |
34 |
2.97 |
11.76 |
32.271 |
1.108 |
T P |
| 2r8a_A |
360 |
65 |
35 |
2.93 |
11.43 |
32.072 |
1.157 |
T P |
| 2fcp_A |
705 |
65 |
31 |
2.83 |
9.68 |
31.657 |
1.057 |
T P |
| 3ddr_A |
753 |
65 |
29 |
2.64 |
3.45 |
30.685 |
1.060 |
T P |
| 3bs0_A |
414 |
65 |
31 |
2.89 |
9.68 |
30.551 |
1.035 |
T P |
| 1oqy_A |
363 |
65 |
25 |
2.32 |
0.00 |
30.323 |
1.032 |
T P |
| 2r4l_B |
421 |
65 |
28 |
2.74 |
7.14 |
29.600 |
0.987 |
T P |
| 2r89_A |
363 |
65 |
29 |
2.76 |
13.79 |
28.831 |
1.013 |
T P |
| 3csl_A |
753 |
65 |
25 |
2.60 |
4.00 |
28.194 |
0.925 |
T P |
| 2r88_A |
365 |
65 |
26 |
2.86 |
7.69 |
27.583 |
0.878 |
T P |
| 2iah_A |
752 |
65 |
25 |
2.71 |
4.00 |
25.666 |
0.890 |
T P |
| 1osm_A |
342 |
65 |
22 |
2.73 |
9.09 |
24.602 |
0.778 |
T P |
| 3dwn_A |
421 |
65 |
22 |
2.52 |
9.09 |
24.300 |
0.839 |
T P |
| 2iwv_A |
277 |
65 |
22 |
2.61 |
0.00 |
23.583 |
0.813 |
T P |
| 1hl9_B |
426 |
65 |
21 |
2.74 |
0.00 |
23.259 |
0.740 |
T P |
| 2ixw_A |
343 |
65 |
21 |
2.66 |
4.76 |
22.906 |
0.762 |
T P |
| 1uun_A |
184 |
65 |
22 |
3.05 |
0.00 |
21.960 |
0.697 |
T P |
| 2jqy_A |
280 |
65 |
17 |
2.62 |
5.88 |
21.213 |
0.626 |
T P |
| 2j1n_A |
346 |
65 |
19 |
2.63 |
5.26 |
20.213 |
0.697 |
T P |
NS : Total number of residues in Structure (rotated structure)
NT : Total number of residues in TARGET (frame of reference)
N : Total number of residues superimposed under 4.0 Angstrom distance cutoff
RMSD : RMS deviation calculated on all N residues superimposed under 4.0 Angstrom distance cutoff
Seq_Id : Sequence Identity. Percent of identical residues from the total of N aligned.
LGA_S : Structure similarity score calculated by internal LGA procedure (see LGA paper for details)
LGA_Q : Score (how tight is the superposition) calculated by the formula: Q = 0.1*N/(0.1+RMSD)
PLOTS : T - Flat text file (output from LGA program, rotated structure)
PLOTS : P - Plot of superimposed structures (3D plot colored as bars)
Citing LGA:
Zemla A., "LGA - a Method for Finding 3D Similarities in Protein Structures",
Nucleic Acids Research, 2003, Vol. 31, No. 13, pp. 3370-3374.
[MEDLINE]

