LGA
Sequence Independent Analysis (LGA)
Frame of reference: Cat.Q2246_545_160.5wLII_11172_11
Total number of 3D structures: 38
LGA calculations using distance cutoff DIST: 4.0 A
Residues superimposed below 2.00 A: GREEN
Residues superimposed below 4.00 A: YELLOW
Residues superimposed below 6.00 A: ORANGE
Residues superimposed below 8.00 A: BROWN
Residues superimposed above 8.00 A or not aligned: RED
Terminal residues not aligned: GREY
Structure Deviation Summary
Calculations based on one final LGA superposition
(Bar representation of 3D plots, TEXT)
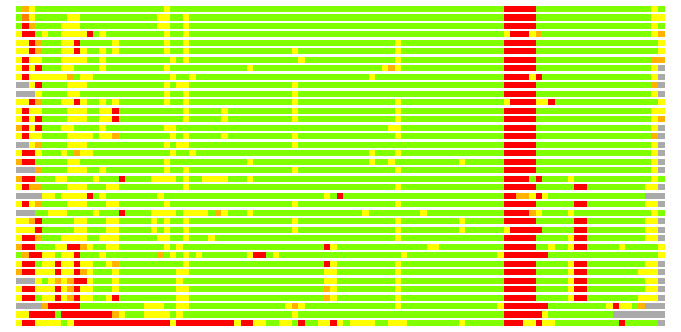
Structures ordered by LGA_S - score
| Structure |
NS |
NT |
N(dist=4.0) |
RMSD(N) |
Seq_ID(N) |
LGA_S |
LGA_Q |
PLOTS |
| 1hv9_B |
450 |
101 |
96 |
0.87 |
15.62 |
93.564 |
9.883 |
T P |
| 3d98_A |
390 |
101 |
96 |
1.33 |
6.25 |
91.067 |
6.709 |
T P |
| 2qkx_A |
388 |
101 |
95 |
1.20 |
5.26 |
91.037 |
7.292 |
T P |
| 1g97_A |
446 |
101 |
95 |
1.51 |
11.58 |
89.630 |
5.905 |
T P |
| 2npo_A |
193 |
101 |
94 |
1.36 |
4.26 |
89.400 |
6.417 |
T P |
| 3bfp_A |
184 |
101 |
94 |
1.38 |
4.26 |
89.317 |
6.371 |
T P |
| 2iu8_A |
346 |
101 |
95 |
1.42 |
13.68 |
89.039 |
6.249 |
T P |
| 2v0h_A |
450 |
101 |
93 |
1.26 |
5.38 |
89.000 |
6.828 |
T P |
| 3fs8_A |
259 |
101 |
94 |
1.51 |
11.70 |
88.709 |
5.821 |
T P |
| 1xhd_A |
172 |
101 |
92 |
1.20 |
11.96 |
88.583 |
7.081 |
T P |
| 1v3w_A |
173 |
101 |
92 |
1.24 |
13.04 |
88.575 |
6.879 |
T P |
| 3bsw_A |
191 |
101 |
94 |
1.47 |
4.26 |
88.553 |
6.004 |
T P |
| 2qia_A |
262 |
101 |
94 |
1.40 |
10.64 |
88.379 |
6.252 |
T P |
| 2jf2_A |
264 |
101 |
93 |
1.41 |
9.68 |
88.106 |
6.167 |
T P |
| 1hm9_A |
458 |
101 |
93 |
1.27 |
9.68 |
88.101 |
6.772 |
T P |
| 2aq9_A |
262 |
101 |
94 |
1.50 |
9.57 |
88.071 |
5.891 |
T P |
| 2eg0_B |
171 |
101 |
93 |
1.25 |
9.68 |
87.867 |
6.877 |
T P |
| 1j2z_A |
259 |
101 |
93 |
1.32 |
11.83 |
87.741 |
6.558 |
T P |
| 2ggo_A |
401 |
101 |
93 |
1.28 |
9.68 |
87.650 |
6.754 |
T P |
| 3cj8_A |
219 |
101 |
92 |
1.30 |
10.87 |
87.320 |
6.548 |
T P |
| 2pig_B |
319 |
101 |
93 |
1.52 |
12.90 |
85.982 |
5.723 |
T P |
| 3ftt_A |
188 |
101 |
92 |
1.48 |
8.70 |
85.049 |
5.820 |
T P |
| 1yp2_C |
432 |
101 |
89 |
1.46 |
6.74 |
85.049 |
5.706 |
T P |
| 1krr_A |
200 |
101 |
92 |
1.49 |
10.87 |
84.845 |
5.786 |
T P |
| 2f9c_A |
320 |
101 |
93 |
1.61 |
12.90 |
84.488 |
5.431 |
T P |
| 1ocx_A |
182 |
101 |
92 |
1.53 |
10.87 |
84.449 |
5.646 |
T P |
| 2p2o_A |
184 |
101 |
92 |
1.52 |
8.70 |
84.176 |
5.685 |
T P |
| 3ect_A |
176 |
101 |
91 |
1.51 |
13.19 |
83.915 |
5.658 |
T P |
| 3f1x_A |
276 |
101 |
89 |
1.54 |
10.11 |
83.108 |
5.430 |
T P |
| 2rij_A |
381 |
101 |
89 |
1.54 |
14.61 |
82.769 |
5.412 |
T P |
| 1s80_A |
241 |
101 |
88 |
1.54 |
5.68 |
82.395 |
5.365 |
T P |
| 1ssq_D |
257 |
101 |
89 |
1.60 |
5.62 |
82.348 |
5.234 |
T P |
| 1t3d_A |
262 |
101 |
88 |
1.56 |
4.55 |
82.065 |
5.293 |
T P |
| 1ssm_A |
240 |
101 |
89 |
1.64 |
5.62 |
82.061 |
5.116 |
T P |
| 1sst_C |
236 |
101 |
88 |
1.60 |
5.68 |
81.870 |
5.164 |
T P |
| 1xat_A |
208 |
101 |
81 |
1.55 |
11.11 |
76.424 |
4.901 |
T P |
| 1fxj_A |
327 |
101 |
75 |
1.34 |
9.33 |
73.367 |
5.221 |
T P |
| 2i5k_B |
466 |
101 |
65 |
2.14 |
7.69 |
53.164 |
2.896 |
T P |
NS : Total number of residues in Structure (rotated structure)
NT : Total number of residues in TARGET (frame of reference)
N : Total number of residues superimposed under 4.0 Angstrom distance cutoff
RMSD : RMS deviation calculated on all N residues superimposed under 4.0 Angstrom distance cutoff
Seq_Id : Sequence Identity. Percent of identical residues from the total of N aligned.
LGA_S : Structure similarity score calculated by internal LGA procedure (see LGA paper for details)
LGA_Q : Score (how tight is the superposition) calculated by the formula: Q = 0.1*N/(0.1+RMSD)
PLOTS : T - Flat text file (output from LGA program, rotated structure)
PLOTS : P - Plot of superimposed structures (3D plot colored as bars)
Citing LGA:
Zemla A., "LGA - a Method for Finding 3D Similarities in Protein Structures",
Nucleic Acids Research, 2003, Vol. 31, No. 13, pp. 3370-3374.
[MEDLINE]