LGA
Sequence Independent Analysis (LGA)
Frame of reference: Cat.Q2246_545_183.5wLII_11181_54
Total number of 3D structures: 43
LGA calculations using distance cutoff DIST: 4.0 A
Residues superimposed below 2.00 A: GREEN
Residues superimposed below 4.00 A: YELLOW
Residues superimposed below 6.00 A: ORANGE
Residues superimposed below 8.00 A: BROWN
Residues superimposed above 8.00 A or not aligned: RED
Terminal residues not aligned: GREY
Structure Deviation Summary
Calculations based on one final LGA superposition
(Bar representation of 3D plots, TEXT)
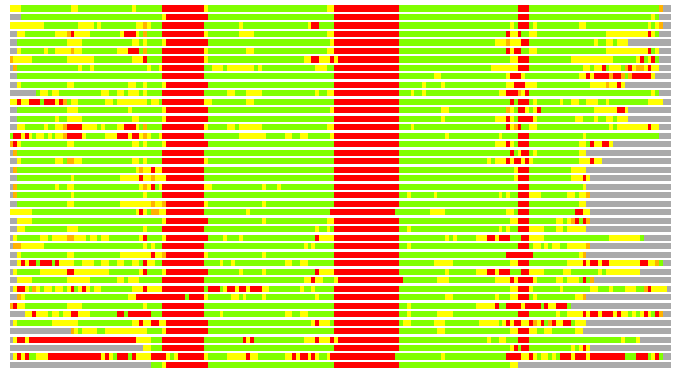
Structures ordered by LGA_S - score
| Structure |
NS |
NT |
N(dist=4.0) |
RMSD(N) |
Seq_ID(N) |
LGA_S |
LGA_Q |
PLOTS |
| 1w3b_A |
388 |
173 |
140 |
1.24 |
15.71 |
77.140 |
10.474 |
T P |
| 2fo7_A |
136 |
173 |
136 |
0.88 |
22.06 |
77.125 |
13.921 |
T P |
| 2vq2_A |
220 |
173 |
138 |
1.58 |
15.22 |
73.109 |
8.214 |
T P |
| 1hh8_A |
192 |
173 |
133 |
1.76 |
14.29 |
70.655 |
7.161 |
T P |
| 2c0l_A |
292 |
173 |
130 |
1.53 |
13.08 |
70.556 |
7.996 |
T P |
| 1e96_B |
185 |
173 |
133 |
1.79 |
15.04 |
70.546 |
7.048 |
T P |
| 2fi7_A |
223 |
173 |
134 |
1.81 |
11.94 |
70.528 |
7.013 |
T P |
| 1xnf_B |
262 |
173 |
135 |
1.87 |
17.04 |
69.730 |
6.859 |
T P |
| 2c2l_A |
281 |
173 |
124 |
1.44 |
16.13 |
69.575 |
8.070 |
T P |
| 3cv0_A |
300 |
173 |
127 |
1.57 |
10.24 |
69.516 |
7.582 |
T P |
| 2ho1_A |
222 |
173 |
131 |
1.69 |
16.79 |
69.202 |
7.337 |
T P |
| 2pl2_A |
194 |
173 |
131 |
1.73 |
13.74 |
69.062 |
7.147 |
T P |
| 3cvq_A |
289 |
173 |
127 |
1.51 |
10.24 |
68.796 |
7.913 |
T P |
| 1fch_A |
302 |
173 |
127 |
1.69 |
14.17 |
68.571 |
7.090 |
T P |
| 1wm5_A |
205 |
173 |
130 |
1.86 |
13.85 |
68.536 |
6.628 |
T P |
| 2q7f_A |
194 |
173 |
127 |
1.74 |
14.17 |
67.744 |
6.889 |
T P |
| 2c0m_C |
302 |
173 |
122 |
1.53 |
13.11 |
65.939 |
7.490 |
T P |
| 2vyi_A |
128 |
173 |
119 |
1.27 |
15.13 |
65.462 |
8.679 |
T P |
| 2j9q_A |
300 |
173 |
120 |
1.69 |
13.33 |
65.008 |
6.700 |
T P |
| 1qz2_A |
285 |
173 |
118 |
1.40 |
15.25 |
64.760 |
7.881 |
T P |
| 1p5q_A |
283 |
173 |
118 |
1.44 |
14.41 |
64.398 |
7.668 |
T P |
| 1ihg_A |
364 |
173 |
118 |
1.48 |
11.86 |
64.111 |
7.467 |
T P |
| 1a17_A |
159 |
173 |
120 |
1.59 |
17.50 |
64.048 |
7.081 |
T P |
| 1kt1_A |
374 |
173 |
119 |
1.56 |
14.29 |
63.827 |
7.175 |
T P |
| 2dba_A |
148 |
173 |
119 |
1.66 |
14.29 |
63.125 |
6.756 |
T P |
| 1na0_A |
119 |
173 |
117 |
1.53 |
22.22 |
63.125 |
7.185 |
T P |
| 1wao_1 |
471 |
173 |
118 |
1.67 |
16.10 |
62.735 |
6.683 |
T P |
| 3edt_B |
258 |
173 |
128 |
2.01 |
10.94 |
62.661 |
6.073 |
T P |
| 2bug_A |
131 |
173 |
120 |
1.79 |
17.50 |
62.451 |
6.355 |
T P |
| 1kt0_A |
357 |
173 |
114 |
1.54 |
14.04 |
61.698 |
6.964 |
T P |
| 2vsy_A |
547 |
173 |
123 |
1.98 |
17.07 |
61.581 |
5.927 |
T P |
| 3ceq_B |
269 |
173 |
125 |
2.05 |
11.20 |
60.434 |
5.817 |
T P |
| 1elr_A |
128 |
173 |
116 |
1.84 |
18.10 |
60.185 |
5.970 |
T P |
| 2gw1_A |
487 |
173 |
124 |
2.00 |
14.52 |
60.115 |
5.894 |
T P |
| 2fbn_A |
153 |
173 |
112 |
1.58 |
15.18 |
59.758 |
6.648 |
T P |
| 1elw_A |
117 |
173 |
105 |
1.64 |
18.10 |
57.138 |
6.042 |
T P |
| 2vsn_A |
534 |
173 |
116 |
1.97 |
12.93 |
57.011 |
5.611 |
T P |
| 2hr2_B |
157 |
173 |
110 |
1.92 |
15.45 |
55.482 |
5.443 |
T P |
| 1zu2_A |
158 |
173 |
103 |
1.74 |
13.59 |
54.267 |
5.583 |
T P |
| 2if4_A |
258 |
173 |
100 |
1.67 |
14.00 |
53.680 |
5.648 |
T P |
| 1na3_A |
86 |
173 |
85 |
1.16 |
17.65 |
47.561 |
6.752 |
T P |
| 1ouv_A |
265 |
173 |
92 |
2.15 |
13.04 |
41.707 |
4.095 |
T P |
| 2avp_A |
68 |
173 |
68 |
0.82 |
22.06 |
38.822 |
7.364 |
T P |
NS : Total number of residues in Structure (rotated structure)
NT : Total number of residues in TARGET (frame of reference)
N : Total number of residues superimposed under 4.0 Angstrom distance cutoff
RMSD : RMS deviation calculated on all N residues superimposed under 4.0 Angstrom distance cutoff
Seq_Id : Sequence Identity. Percent of identical residues from the total of N aligned.
LGA_S : Structure similarity score calculated by internal LGA procedure (see LGA paper for details)
LGA_Q : Score (how tight is the superposition) calculated by the formula: Q = 0.1*N/(0.1+RMSD)
PLOTS : T - Flat text file (output from LGA program, rotated structure)
PLOTS : P - Plot of superimposed structures (3D plot colored as bars)
Citing LGA:
Zemla A., "LGA - a Method for Finding 3D Similarities in Protein Structures",
Nucleic Acids Research, 2003, Vol. 31, No. 13, pp. 3370-3374.
[MEDLINE]