LGA
Sequence Independent Analysis (LGA)
Frame of reference: Cat.Q2246_545_211.5wLII_11184_36
Total number of 3D structures: 39
LGA calculations using distance cutoff DIST: 4.0 A
Residues superimposed below 2.00 A: GREEN
Residues superimposed below 4.00 A: YELLOW
Residues superimposed below 6.00 A: ORANGE
Residues superimposed below 8.00 A: BROWN
Residues superimposed above 8.00 A or not aligned: RED
Terminal residues not aligned: GREY
Structure Deviation Summary
Calculations based on one final LGA superposition
(Bar representation of 3D plots, TEXT)
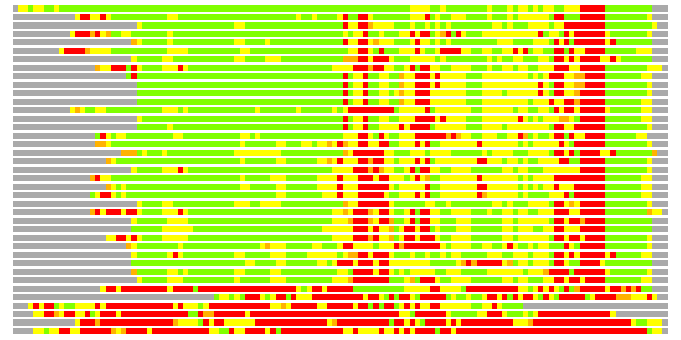
Structures ordered by LGA_S - score
| Structure |
NS |
NT |
N(dist=4.0) |
RMSD(N) |
Seq_ID(N) |
LGA_S |
LGA_Q |
PLOTS |
| 3bwl_A |
125 |
127 |
118 |
1.39 |
15.25 |
87.678 |
7.912 |
T P |
| 2r78_C |
116 |
127 |
98 |
1.80 |
11.22 |
69.943 |
5.166 |
T P |
| 3f1p_B |
111 |
127 |
90 |
1.88 |
7.78 |
60.856 |
4.549 |
T P |
| 1d06_A |
130 |
127 |
95 |
2.11 |
15.79 |
59.908 |
4.291 |
T P |
| 2b02_A |
111 |
127 |
88 |
1.85 |
6.82 |
59.437 |
4.516 |
T P |
| 1s67_L |
119 |
127 |
94 |
2.12 |
13.83 |
57.072 |
4.226 |
T P |
| 3f1p_A |
114 |
127 |
88 |
1.94 |
9.09 |
56.776 |
4.308 |
T P |
| 2v1b_A |
144 |
127 |
89 |
2.10 |
15.73 |
56.297 |
4.040 |
T P |
| 1y28_A |
119 |
127 |
88 |
1.99 |
15.91 |
56.244 |
4.201 |
T P |
| 1bv6_A |
119 |
127 |
87 |
2.03 |
17.24 |
55.759 |
4.083 |
T P |
| 2cmn_A |
117 |
127 |
87 |
2.00 |
16.09 |
55.359 |
4.145 |
T P |
| 1lsw_A |
117 |
127 |
87 |
2.01 |
14.94 |
55.262 |
4.122 |
T P |
| 2gj3_A |
119 |
127 |
95 |
2.07 |
12.63 |
54.984 |
4.386 |
T P |
| 2vv6_D |
107 |
127 |
87 |
2.08 |
18.39 |
54.826 |
3.996 |
T P |
| 1xj3_A |
116 |
127 |
85 |
1.93 |
16.47 |
54.155 |
4.194 |
T P |
| 1v9y_A |
103 |
127 |
88 |
2.08 |
13.64 |
53.791 |
4.034 |
T P |
| 1gsv_A |
122 |
127 |
93 |
2.22 |
10.75 |
53.612 |
4.015 |
T P |
| 2a24_B |
108 |
127 |
90 |
2.17 |
6.67 |
53.539 |
3.969 |
T P |
| 1f9i_A |
125 |
127 |
90 |
2.15 |
10.00 |
52.942 |
4.001 |
T P |
| 2pr5_A |
127 |
127 |
88 |
2.02 |
17.05 |
52.750 |
4.155 |
T P |
| 1d7e_A |
119 |
127 |
90 |
2.22 |
8.89 |
52.443 |
3.886 |
T P |
| 1ot6_A |
125 |
127 |
89 |
2.19 |
11.24 |
52.164 |
3.888 |
T P |
| 1otd_A |
105 |
127 |
91 |
2.14 |
9.89 |
51.940 |
4.067 |
T P |
| 1x0o_A |
119 |
127 |
87 |
1.94 |
8.05 |
51.322 |
4.275 |
T P |
| 2v0u_A |
146 |
127 |
88 |
2.21 |
14.77 |
51.163 |
3.807 |
T P |
| 1n9l_A |
109 |
127 |
85 |
2.05 |
12.94 |
50.907 |
3.951 |
T P |
| 1byw_A |
110 |
127 |
86 |
2.07 |
15.12 |
50.511 |
3.965 |
T P |
| 2z6d_A |
118 |
127 |
86 |
2.13 |
15.12 |
50.439 |
3.853 |
T P |
| 1ll8_A |
114 |
127 |
85 |
2.09 |
15.29 |
50.018 |
3.876 |
T P |
| 2a24_A |
107 |
127 |
86 |
2.11 |
8.14 |
49.055 |
3.896 |
T P |
| 3fc7_A |
100 |
127 |
81 |
2.17 |
11.11 |
48.934 |
3.568 |
T P |
| 1p97_A |
114 |
127 |
85 |
2.03 |
7.06 |
48.929 |
3.991 |
T P |
| 2z6c_A |
121 |
127 |
82 |
2.02 |
13.41 |
47.605 |
3.859 |
T P |
| 2ebf_X |
711 |
127 |
42 |
2.37 |
9.52 |
24.710 |
1.698 |
T P |
| 2ebh_X |
711 |
127 |
43 |
2.59 |
13.95 |
23.377 |
1.596 |
T P |
| 2c2a_A |
240 |
127 |
46 |
2.73 |
10.87 |
22.417 |
1.624 |
T P |
| 2r6s_A |
299 |
127 |
33 |
2.75 |
9.09 |
18.583 |
1.159 |
T P |
| 1jfy_A |
306 |
127 |
33 |
3.07 |
15.15 |
17.866 |
1.042 |
T P |
| 2ec5_A |
711 |
127 |
34 |
2.92 |
2.94 |
17.806 |
1.125 |
T P |
NS : Total number of residues in Structure (rotated structure)
NT : Total number of residues in TARGET (frame of reference)
N : Total number of residues superimposed under 4.0 Angstrom distance cutoff
RMSD : RMS deviation calculated on all N residues superimposed under 4.0 Angstrom distance cutoff
Seq_Id : Sequence Identity. Percent of identical residues from the total of N aligned.
LGA_S : Structure similarity score calculated by internal LGA procedure (see LGA paper for details)
LGA_Q : Score (how tight is the superposition) calculated by the formula: Q = 0.1*N/(0.1+RMSD)
PLOTS : T - Flat text file (output from LGA program, rotated structure)
PLOTS : P - Plot of superimposed structures (3D plot colored as bars)
Citing LGA:
Zemla A., "LGA - a Method for Finding 3D Similarities in Protein Structures",
Nucleic Acids Research, 2003, Vol. 31, No. 13, pp. 3370-3374.
[MEDLINE]