LGA
Sequence Independent Analysis (LGA)
Frame of reference: Cat.Q2246_545_214.5wLII_11184_47
Total number of 3D structures: 36
LGA calculations using distance cutoff DIST: 4.0 A
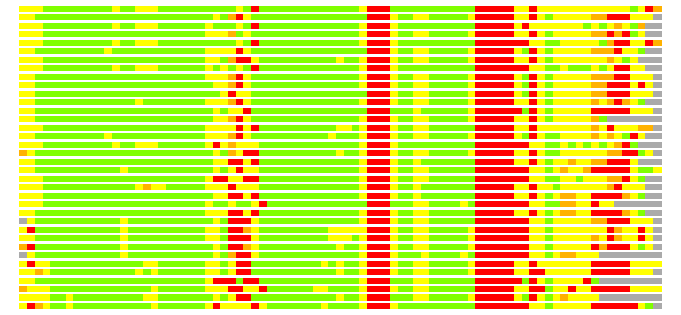
Residues superimposed below 2.00 A: GREEN
Residues superimposed below 4.00 A: YELLOW
Residues superimposed below 6.00 A: ORANGE
Residues superimposed below 8.00 A: BROWN
Residues superimposed above 8.00 A or not aligned: RED
Terminal residues not aligned: GREY
Structure Deviation Summary
Calculations based on one final LGA superposition
(Bar representation of 3D plots, TEXT)

Structures ordered by LGA_S - score
| Structure |
NS |
NT |
N(dist=4.0) |
RMSD(N) |
Seq_ID(N) |
LGA_S |
LGA_Q |
PLOTS |
| 1j71_A |
334 |
83 |
72 |
1.97 |
13.89 |
76.457 |
3.484 |
T P |
| 1psa_A |
326 |
83 |
69 |
1.92 |
13.04 |
75.872 |
3.412 |
T P |
| 1eag_A |
339 |
83 |
71 |
1.97 |
14.08 |
75.718 |
3.438 |
T P |
| 1tzs_A |
322 |
83 |
70 |
1.96 |
15.71 |
75.468 |
3.404 |
T P |
| 2qzw_A |
341 |
83 |
69 |
1.87 |
14.49 |
75.255 |
3.508 |
T P |
| 3cms_A |
320 |
83 |
70 |
2.01 |
14.29 |
75.233 |
3.324 |
T P |
| 1b5f_A |
239 |
83 |
69 |
1.99 |
13.04 |
74.988 |
3.297 |
T P |
| 2h6t_A |
340 |
83 |
68 |
1.79 |
10.29 |
74.880 |
3.597 |
T P |
| 5pep_A |
326 |
83 |
70 |
2.01 |
12.86 |
74.878 |
3.313 |
T P |
| 1f34_A |
326 |
83 |
68 |
1.97 |
13.24 |
74.514 |
3.280 |
T P |
| 1flh_A |
326 |
83 |
69 |
1.92 |
13.04 |
74.446 |
3.424 |
T P |
| 1qrp_E |
326 |
83 |
70 |
2.06 |
12.86 |
74.377 |
3.248 |
T P |
| 4cms_A |
320 |
83 |
66 |
1.70 |
12.12 |
74.377 |
3.660 |
T P |
| 4pep_A |
326 |
83 |
66 |
1.80 |
13.64 |
73.927 |
3.470 |
T P |
| 1htr_B |
329 |
83 |
70 |
2.06 |
17.14 |
73.504 |
3.241 |
T P |
| 1am5_A |
324 |
83 |
70 |
2.12 |
11.43 |
73.390 |
3.152 |
T P |
| 1zap_A |
341 |
83 |
68 |
1.95 |
14.71 |
72.901 |
3.318 |
T P |
| 1lya_B |
241 |
83 |
69 |
2.09 |
8.70 |
72.786 |
3.152 |
T P |
| 1fq5_A |
329 |
83 |
65 |
2.00 |
13.85 |
71.345 |
3.093 |
T P |
| 1smr_A |
331 |
83 |
67 |
1.94 |
11.94 |
71.323 |
3.288 |
T P |
| 1qdm_A |
430 |
83 |
66 |
1.94 |
16.67 |
71.036 |
3.240 |
T P |
| 2qzx_A |
342 |
83 |
70 |
2.13 |
11.43 |
70.917 |
3.144 |
T P |
| 1g0v_A |
329 |
83 |
65 |
1.88 |
13.85 |
70.897 |
3.280 |
T P |
| 2asi_A |
356 |
83 |
65 |
1.87 |
16.92 |
70.839 |
3.307 |
T P |
| 1dpj_A |
329 |
83 |
65 |
1.89 |
13.85 |
70.727 |
3.268 |
T P |
| 2g24_A |
329 |
83 |
65 |
1.92 |
9.23 |
70.419 |
3.220 |
T P |
| 2iko_A |
338 |
83 |
67 |
2.15 |
10.45 |
70.187 |
2.975 |
T P |
| 1hrn_A |
334 |
83 |
67 |
2.08 |
10.45 |
69.972 |
3.072 |
T P |
| 2i4q_A |
336 |
83 |
65 |
1.99 |
9.23 |
69.806 |
3.116 |
T P |
| 3d91_B |
337 |
83 |
62 |
1.80 |
11.29 |
69.156 |
3.258 |
T P |
| 1lf2_A |
329 |
83 |
66 |
2.05 |
9.09 |
68.239 |
3.065 |
T P |
| 2bju_A |
329 |
83 |
65 |
2.00 |
7.69 |
67.854 |
3.088 |
T P |
| 3psg_A |
365 |
83 |
59 |
1.52 |
11.86 |
67.253 |
3.633 |
T P |
| 3f9q_A |
325 |
83 |
64 |
2.00 |
6.25 |
65.785 |
3.043 |
T P |
| 2anl_A |
327 |
83 |
64 |
2.05 |
6.25 |
65.669 |
2.976 |
T P |
| 1pfz_A |
370 |
83 |
63 |
2.06 |
6.35 |
64.437 |
2.923 |
T P |
NS : Total number of residues in Structure (rotated structure)
NT : Total number of residues in TARGET (frame of reference)
N : Total number of residues superimposed under 4.0 Angstrom distance cutoff
RMSD : RMS deviation calculated on all N residues superimposed under 4.0 Angstrom distance cutoff
Seq_Id : Sequence Identity. Percent of identical residues from the total of N aligned.
LGA_S : Structure similarity score calculated by internal LGA procedure (see LGA paper for details)
LGA_Q : Score (how tight is the superposition) calculated by the formula: Q = 0.1*N/(0.1+RMSD)
PLOTS : T - Flat text file (output from LGA program, rotated structure)
PLOTS : P - Plot of superimposed structures (3D plot colored as bars)
Citing LGA:
Zemla A., "LGA - a Method for Finding 3D Similarities in Protein Structures",
Nucleic Acids Research, 2003, Vol. 31, No. 13, pp. 3370-3374.
[MEDLINE]

