LGA
Sequence Independent Analysis (LGA)
Frame of reference: Cat.Q2246_545_216.5wLII_11184_56
Total number of 3D structures: 42
LGA calculations using distance cutoff DIST: 4.0 A
Residues superimposed below 2.00 A: GREEN
Residues superimposed below 4.00 A: YELLOW
Residues superimposed below 6.00 A: ORANGE
Residues superimposed below 8.00 A: BROWN
Residues superimposed above 8.00 A or not aligned: RED
Terminal residues not aligned: GREY
Structure Deviation Summary
Calculations based on one final LGA superposition
(Bar representation of 3D plots, TEXT)
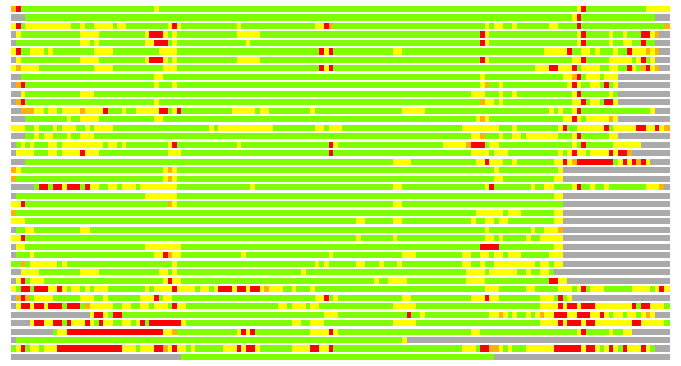
Structures ordered by LGA_S - score
| Structure |
NS |
NT |
N(dist=4.0) |
RMSD(N) |
Seq_ID(N) |
LGA_S |
LGA_Q |
PLOTS |
| 1w3b_A |
388 |
143 |
141 |
1.17 |
17.73 |
95.142 |
11.090 |
T P |
| 2fo7_A |
136 |
143 |
136 |
0.35 |
24.26 |
94.942 |
29.990 |
T P |
| 2vq2_A |
220 |
143 |
139 |
1.68 |
12.95 |
89.799 |
7.807 |
T P |
| 1hh8_A |
192 |
143 |
133 |
1.39 |
15.04 |
88.897 |
8.955 |
T P |
| 1e96_B |
185 |
143 |
133 |
1.30 |
15.04 |
88.860 |
9.487 |
T P |
| 2fi7_A |
223 |
143 |
136 |
1.63 |
14.71 |
88.394 |
7.855 |
T P |
| 1wm5_A |
205 |
143 |
133 |
1.44 |
15.04 |
87.808 |
8.636 |
T P |
| 2ho1_A |
222 |
143 |
134 |
1.68 |
14.18 |
87.336 |
7.521 |
T P |
| 2c0m_C |
302 |
143 |
129 |
1.41 |
14.73 |
86.821 |
8.526 |
T P |
| 3cv0_A |
300 |
143 |
128 |
1.31 |
13.28 |
85.888 |
9.049 |
T P |
| 2c0l_A |
292 |
143 |
129 |
1.24 |
14.73 |
85.888 |
9.644 |
T P |
| 3cvq_A |
289 |
143 |
127 |
1.32 |
11.81 |
84.747 |
8.950 |
T P |
| 2q7f_A |
194 |
143 |
133 |
1.93 |
15.79 |
84.499 |
6.541 |
T P |
| 2j9q_A |
300 |
143 |
128 |
1.61 |
14.84 |
84.480 |
7.503 |
T P |
| 1xnf_B |
262 |
143 |
138 |
2.02 |
12.32 |
84.207 |
6.509 |
T P |
| 1fch_A |
302 |
143 |
128 |
1.49 |
14.84 |
84.100 |
8.057 |
T P |
| 3ceq_B |
269 |
143 |
130 |
1.76 |
11.54 |
82.989 |
7.006 |
T P |
| 3edt_B |
258 |
143 |
128 |
1.81 |
12.50 |
81.815 |
6.711 |
T P |
| 2c2l_A |
281 |
143 |
123 |
1.67 |
12.20 |
81.474 |
6.931 |
T P |
| 1qz2_A |
285 |
143 |
120 |
1.17 |
20.00 |
81.352 |
9.462 |
T P |
| 1p5q_A |
283 |
143 |
120 |
1.20 |
19.17 |
81.337 |
9.240 |
T P |
| 2pl2_A |
194 |
143 |
127 |
1.84 |
13.39 |
81.107 |
6.547 |
T P |
| 1kt1_A |
374 |
143 |
119 |
1.13 |
18.49 |
80.337 |
9.673 |
T P |
| 1ihg_A |
364 |
143 |
119 |
1.18 |
12.61 |
80.334 |
9.290 |
T P |
| 2vyi_A |
128 |
143 |
120 |
1.36 |
21.67 |
79.751 |
8.193 |
T P |
| 1a17_A |
159 |
143 |
120 |
1.34 |
15.00 |
79.392 |
8.316 |
T P |
| 1na0_A |
119 |
143 |
119 |
1.32 |
27.73 |
79.027 |
8.357 |
T P |
| 1wao_1 |
471 |
143 |
119 |
1.37 |
15.97 |
78.404 |
8.069 |
T P |
| 1kt0_A |
357 |
143 |
115 |
1.25 |
15.65 |
76.865 |
8.492 |
T P |
| 2fbn_A |
153 |
143 |
118 |
1.59 |
16.10 |
76.681 |
6.969 |
T P |
| 2bug_A |
131 |
143 |
120 |
1.74 |
15.00 |
76.021 |
6.522 |
T P |
| 1elw_A |
117 |
143 |
116 |
1.57 |
15.52 |
75.255 |
6.959 |
T P |
| 2dba_A |
148 |
143 |
116 |
1.59 |
18.97 |
75.107 |
6.883 |
T P |
| 2gw1_A |
487 |
143 |
127 |
2.00 |
16.54 |
74.594 |
6.061 |
T P |
| 1elr_A |
128 |
143 |
116 |
1.79 |
12.93 |
74.264 |
6.143 |
T P |
| 2vsy_A |
547 |
143 |
122 |
2.05 |
15.57 |
73.415 |
5.675 |
T P |
| 2e2e_A |
171 |
143 |
111 |
1.86 |
15.32 |
72.057 |
5.663 |
T P |
| 2vsn_A |
534 |
143 |
116 |
2.01 |
13.79 |
70.912 |
5.489 |
T P |
| 2if4_A |
258 |
143 |
101 |
1.61 |
11.88 |
65.952 |
5.890 |
T P |
| 1na3_A |
86 |
143 |
85 |
0.92 |
27.06 |
58.708 |
8.368 |
T P |
| 1ouv_A |
265 |
143 |
103 |
2.34 |
11.65 |
54.025 |
4.222 |
T P |
| 2avp_A |
68 |
143 |
68 |
0.46 |
33.82 |
47.497 |
12.224 |
T P |
NS : Total number of residues in Structure (rotated structure)
NT : Total number of residues in TARGET (frame of reference)
N : Total number of residues superimposed under 4.0 Angstrom distance cutoff
RMSD : RMS deviation calculated on all N residues superimposed under 4.0 Angstrom distance cutoff
Seq_Id : Sequence Identity. Percent of identical residues from the total of N aligned.
LGA_S : Structure similarity score calculated by internal LGA procedure (see LGA paper for details)
LGA_Q : Score (how tight is the superposition) calculated by the formula: Q = 0.1*N/(0.1+RMSD)
PLOTS : T - Flat text file (output from LGA program, rotated structure)
PLOTS : P - Plot of superimposed structures (3D plot colored as bars)
Citing LGA:
Zemla A., "LGA - a Method for Finding 3D Similarities in Protein Structures",
Nucleic Acids Research, 2003, Vol. 31, No. 13, pp. 3370-3374.
[MEDLINE]