LGA
Sequence Independent Analysis (LGA)
Frame of reference: Cat.Q2246_545_233.5wLII_11195_36
Total number of 3D structures: 36
LGA calculations using distance cutoff DIST: 4.0 A
Residues superimposed below 2.00 A: GREEN
Residues superimposed below 4.00 A: YELLOW
Residues superimposed below 6.00 A: ORANGE
Residues superimposed below 8.00 A: BROWN
Residues superimposed above 8.00 A or not aligned: RED
Terminal residues not aligned: GREY
Structure Deviation Summary
Calculations based on one final LGA superposition
(Bar representation of 3D plots, TEXT)
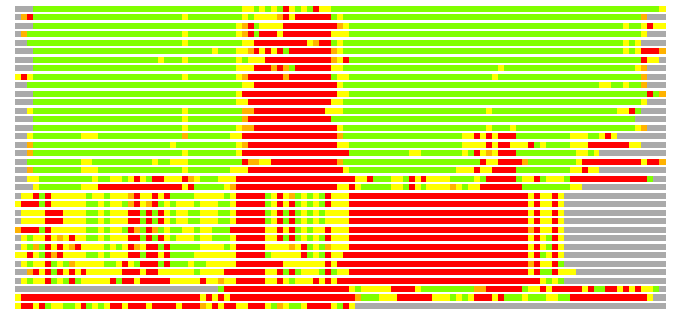
Structures ordered by LGA_S - score
| Structure |
NS |
NT |
N(dist=4.0) |
RMSD(N) |
Seq_ID(N) |
LGA_S |
LGA_Q |
PLOTS |
| 2pii_A |
112 |
109 |
104 |
1.11 |
25.00 |
92.737 |
8.586 |
T P |
| 2j9d_E |
116 |
109 |
97 |
1.30 |
25.77 |
86.412 |
6.911 |
T P |
| 2v5h_G |
111 |
109 |
95 |
1.42 |
25.26 |
83.317 |
6.269 |
T P |
| 2j9c_A |
117 |
109 |
93 |
1.32 |
26.88 |
83.265 |
6.563 |
T P |
| 2ns1_B |
113 |
109 |
92 |
1.16 |
20.65 |
83.015 |
7.293 |
T P |
| 1vfj_A |
116 |
109 |
93 |
1.49 |
22.58 |
82.199 |
5.858 |
T P |
| 1qy7_A |
112 |
109 |
92 |
1.25 |
27.17 |
81.836 |
6.796 |
T P |
| 1gnk_B |
112 |
109 |
93 |
1.45 |
18.28 |
81.671 |
6.010 |
T P |
| 2o66_B |
108 |
109 |
92 |
1.37 |
23.91 |
81.366 |
6.253 |
T P |
| 3bzq_A |
99 |
109 |
90 |
1.23 |
27.78 |
81.008 |
6.778 |
T P |
| 1ul3_A |
95 |
109 |
89 |
1.03 |
25.84 |
80.263 |
7.872 |
T P |
| 2eg2_A |
95 |
109 |
89 |
1.05 |
25.84 |
79.857 |
7.768 |
T P |
| 2gw8_A |
99 |
109 |
90 |
1.42 |
24.44 |
79.583 |
5.916 |
T P |
| 1hwu_B |
101 |
109 |
87 |
0.93 |
27.59 |
78.758 |
8.455 |
T P |
| 2gnk_A |
95 |
109 |
89 |
1.37 |
19.10 |
78.388 |
6.037 |
T P |
| 2dcl_A |
99 |
109 |
77 |
1.65 |
15.58 |
66.494 |
4.388 |
T P |
| 2cz4_A |
100 |
109 |
77 |
1.82 |
24.68 |
65.278 |
4.017 |
T P |
| 3dfe_B |
83 |
109 |
74 |
1.52 |
18.92 |
64.281 |
4.574 |
T P |
| 2gx8_C |
364 |
109 |
78 |
1.89 |
15.38 |
63.223 |
3.917 |
T P |
| 1o2c_A |
89 |
109 |
74 |
1.73 |
17.57 |
63.065 |
4.050 |
T P |
| 2pq4_A |
90 |
109 |
59 |
2.33 |
11.86 |
38.316 |
2.433 |
T P |
| 2b9w_A |
423 |
109 |
51 |
2.30 |
0.00 |
33.029 |
2.128 |
T P |
| 1y5v_A |
360 |
109 |
47 |
2.73 |
4.26 |
27.374 |
1.663 |
T P |
| 1r5y_A |
361 |
109 |
46 |
2.79 |
2.17 |
26.887 |
1.593 |
T P |
| 1wke_A |
372 |
109 |
45 |
2.65 |
2.22 |
26.837 |
1.637 |
T P |
| 1wkf_A |
372 |
109 |
45 |
2.65 |
2.22 |
26.764 |
1.636 |
T P |
| 1ozq_A |
372 |
109 |
45 |
2.71 |
4.44 |
26.582 |
1.604 |
T P |
| 1wkd_A |
372 |
109 |
45 |
2.61 |
2.22 |
26.493 |
1.658 |
T P |
| 2z1v_A |
369 |
109 |
46 |
2.76 |
6.52 |
26.397 |
1.611 |
T P |
| 2oko_A |
365 |
109 |
44 |
2.81 |
6.82 |
26.325 |
1.511 |
T P |
| 2nqz_A |
360 |
109 |
42 |
2.74 |
9.52 |
24.904 |
1.478 |
T P |
| 1pxg_A |
365 |
109 |
40 |
2.97 |
7.50 |
22.902 |
1.303 |
T P |
| 1efz_A |
372 |
109 |
38 |
2.91 |
7.89 |
22.719 |
1.262 |
T P |
| 3bld_A |
348 |
109 |
32 |
2.45 |
6.25 |
21.635 |
1.254 |
T P |
| 1c7n_A |
394 |
109 |
31 |
2.57 |
3.23 |
19.371 |
1.162 |
T P |
| 3bll_A |
347 |
109 |
30 |
2.86 |
3.33 |
19.237 |
1.013 |
T P |
NS : Total number of residues in Structure (rotated structure)
NT : Total number of residues in TARGET (frame of reference)
N : Total number of residues superimposed under 4.0 Angstrom distance cutoff
RMSD : RMS deviation calculated on all N residues superimposed under 4.0 Angstrom distance cutoff
Seq_Id : Sequence Identity. Percent of identical residues from the total of N aligned.
LGA_S : Structure similarity score calculated by internal LGA procedure (see LGA paper for details)
LGA_Q : Score (how tight is the superposition) calculated by the formula: Q = 0.1*N/(0.1+RMSD)
PLOTS : T - Flat text file (output from LGA program, rotated structure)
PLOTS : P - Plot of superimposed structures (3D plot colored as bars)
Citing LGA:
Zemla A., "LGA - a Method for Finding 3D Similarities in Protein Structures",
Nucleic Acids Research, 2003, Vol. 31, No. 13, pp. 3370-3374.
[MEDLINE]