LGA
Sequence Independent Analysis (LGA)
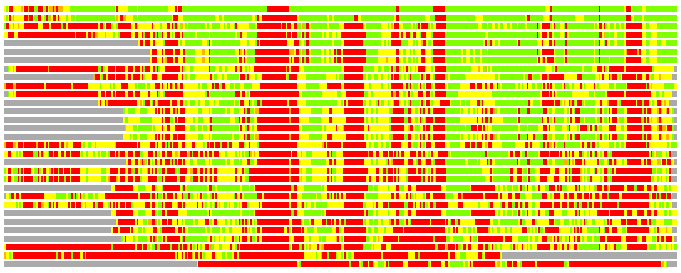
Frame of reference: Cat.Q2246_545_253.5wLII_11212_89
Total number of 3D structures: 31
LGA calculations using distance cutoff DIST: 4.0 A
Residues superimposed below 2.00 A: GREEN
Residues superimposed below 4.00 A: YELLOW
Residues superimposed below 6.00 A: ORANGE
Residues superimposed below 8.00 A: BROWN
Residues superimposed above 8.00 A or not aligned: RED
Terminal residues not aligned: GREY
Structure Deviation Summary
Calculations based on one final LGA superposition
(Bar representation of 3D plots, TEXT)

Structures ordered by LGA_S - score
| Structure |
NS |
NT |
N(dist=4.0) |
RMSD(N) |
Seq_ID(N) |
LGA_S |
LGA_Q |
PLOTS |
| 1v7w_A |
779 |
401 |
357 |
1.33 |
16.53 |
86.449 |
25.028 |
T P |
| 2cqs_A |
822 |
401 |
345 |
1.68 |
15.07 |
80.409 |
19.382 |
T P |
| 3c68_A |
758 |
401 |
273 |
2.14 |
12.09 |
48.886 |
12.195 |
T P |
| 2ds3_A |
758 |
401 |
252 |
1.98 |
13.89 |
46.351 |
12.136 |
T P |
| 2z07_B |
403 |
401 |
238 |
1.99 |
13.87 |
44.496 |
11.369 |
T P |
| 2jf4_A |
500 |
401 |
229 |
2.01 |
11.79 |
43.971 |
10.828 |
T P |
| 2jg0_A |
507 |
401 |
227 |
1.94 |
12.33 |
43.233 |
11.107 |
T P |
| 2okx_A |
954 |
401 |
234 |
2.23 |
14.53 |
40.511 |
10.023 |
T P |
| 2nvp_A |
430 |
401 |
227 |
2.33 |
12.78 |
40.166 |
9.350 |
T P |
| 1ulv_A |
1019 |
401 |
248 |
2.44 |
10.08 |
38.768 |
9.745 |
T P |
| 3cih_A |
714 |
401 |
225 |
2.40 |
16.44 |
38.071 |
8.992 |
T P |
| 2p0v_A |
443 |
401 |
215 |
2.37 |
13.49 |
37.447 |
8.720 |
T P |
| 3gly_A |
470 |
401 |
227 |
2.37 |
11.01 |
36.688 |
9.178 |
T P |
| 2vn4_A |
599 |
401 |
227 |
2.34 |
13.22 |
36.617 |
9.321 |
T P |
| 2fba_A |
492 |
401 |
219 |
2.23 |
15.98 |
36.454 |
9.401 |
T P |
| 1gai_A |
472 |
401 |
227 |
2.38 |
10.57 |
36.398 |
9.148 |
T P |
| 1lf6_A |
674 |
401 |
227 |
2.59 |
7.05 |
35.160 |
8.435 |
T P |
| 2eae_A |
887 |
401 |
220 |
2.50 |
7.27 |
34.664 |
8.472 |
T P |
| 1gah_A |
471 |
401 |
216 |
2.41 |
8.33 |
34.601 |
8.602 |
T P |
| 2eab_A |
888 |
401 |
220 |
2.55 |
5.91 |
33.806 |
8.314 |
T P |
| 2ead_A |
886 |
401 |
213 |
2.52 |
7.04 |
33.363 |
8.132 |
T P |
| 1ump_A |
619 |
401 |
195 |
2.20 |
10.77 |
32.674 |
8.488 |
T P |
| 1h54_B |
754 |
401 |
200 |
2.45 |
9.50 |
32.386 |
7.839 |
T P |
| 2rdy_A |
787 |
401 |
221 |
2.70 |
7.69 |
32.153 |
7.892 |
T P |
| 2sqc_A |
623 |
401 |
201 |
2.30 |
10.45 |
31.966 |
8.368 |
T P |
| 1l1y_A |
642 |
401 |
202 |
2.55 |
6.93 |
30.704 |
7.619 |
T P |
| 1v5d_A |
386 |
401 |
199 |
2.49 |
9.55 |
30.604 |
7.683 |
T P |
| 2gz6_A |
372 |
401 |
181 |
2.52 |
11.05 |
28.351 |
6.905 |
T P |
| 1clc_A |
541 |
401 |
165 |
2.61 |
9.70 |
25.597 |
6.087 |
T P |
| 1yuy_A |
558 |
401 |
84 |
2.63 |
7.14 |
13.562 |
3.071 |
T P |
| 4tmk_A |
210 |
401 |
56 |
2.49 |
8.93 |
9.404 |
2.158 |
T P |
NS : Total number of residues in Structure (rotated structure)
NT : Total number of residues in TARGET (frame of reference)
N : Total number of residues superimposed under 4.0 Angstrom distance cutoff
RMSD : RMS deviation calculated on all N residues superimposed under 4.0 Angstrom distance cutoff
Seq_Id : Sequence Identity. Percent of identical residues from the total of N aligned.
LGA_S : Structure similarity score calculated by internal LGA procedure (see LGA paper for details)
LGA_Q : Score (how tight is the superposition) calculated by the formula: Q = 0.1*N/(0.1+RMSD)
PLOTS : T - Flat text file (output from LGA program, rotated structure)
PLOTS : P - Plot of superimposed structures (3D plot colored as bars)
Citing LGA:
Zemla A., "LGA - a Method for Finding 3D Similarities in Protein Structures",
Nucleic Acids Research, 2003, Vol. 31, No. 13, pp. 3370-3374.
[MEDLINE]

