LGA
Sequence Independent Analysis (LGA)
Frame of reference: Cat.Q2246_545_255.5wLII_11212_106
Total number of 3D structures: 52
LGA calculations using distance cutoff DIST: 4.0 A
Residues superimposed below 2.00 A: GREEN
Residues superimposed below 4.00 A: YELLOW
Residues superimposed below 6.00 A: ORANGE
Residues superimposed below 8.00 A: BROWN
Residues superimposed above 8.00 A or not aligned: RED
Terminal residues not aligned: GREY
Structure Deviation Summary
Calculations based on one final LGA superposition
(Bar representation of 3D plots, TEXT)
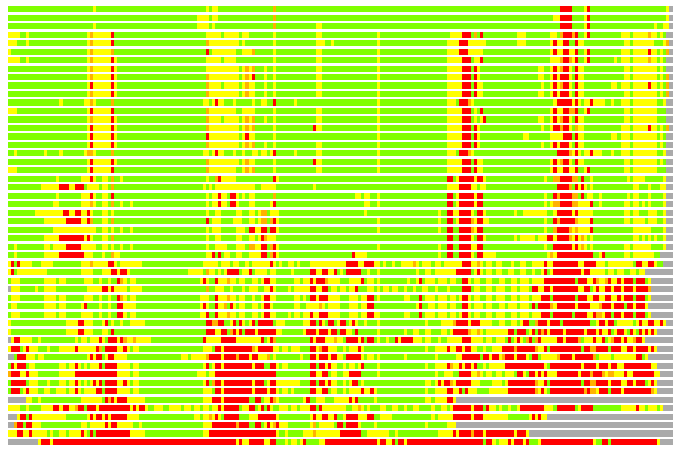
Structures ordered by LGA_S - score
| Structure |
NS |
NT |
N(dist=4.0) |
RMSD(N) |
Seq_ID(N) |
LGA_S |
LGA_Q |
PLOTS |
| 3dhz_B |
296 |
218 |
212 |
0.74 |
16.98 |
96.099 |
25.169 |
T P |
| 1r2f_A |
283 |
218 |
212 |
0.90 |
19.34 |
95.302 |
21.109 |
T P |
| 1uzr_B |
288 |
218 |
212 |
0.96 |
17.45 |
94.825 |
19.908 |
T P |
| 2av8_A |
340 |
218 |
206 |
1.75 |
14.08 |
86.554 |
11.154 |
T P |
| 2alx_A |
339 |
218 |
209 |
1.78 |
13.88 |
86.536 |
11.103 |
T P |
| 1rsr_B |
341 |
218 |
207 |
1.80 |
13.53 |
86.468 |
10.870 |
T P |
| 1av8_A |
340 |
218 |
207 |
1.77 |
14.01 |
86.456 |
11.091 |
T P |
| 1pj0_A |
340 |
218 |
207 |
1.79 |
13.53 |
86.055 |
10.960 |
T P |
| 1mxr_A |
339 |
218 |
206 |
1.79 |
14.08 |
85.929 |
10.915 |
T P |
| 1piy_A |
340 |
218 |
206 |
1.80 |
14.08 |
85.892 |
10.863 |
T P |
| 1piz_A |
340 |
218 |
207 |
1.81 |
13.53 |
85.852 |
10.849 |
T P |
| 2ani_A |
317 |
218 |
204 |
1.69 |
11.76 |
85.840 |
11.414 |
T P |
| 1yfd_B |
341 |
218 |
205 |
1.77 |
14.15 |
85.832 |
10.941 |
T P |
| 1pm2_A |
339 |
218 |
207 |
1.81 |
14.01 |
85.800 |
10.851 |
T P |
| 1biq_A |
339 |
218 |
205 |
1.80 |
13.66 |
85.695 |
10.800 |
T P |
| 1pfr_A |
340 |
218 |
204 |
1.77 |
14.22 |
85.671 |
10.892 |
T P |
| 1rib_A |
340 |
218 |
205 |
1.80 |
14.15 |
85.595 |
10.783 |
T P |
| 1syy_A |
317 |
218 |
205 |
1.74 |
11.71 |
85.496 |
11.144 |
T P |
| 1rnr_A |
339 |
218 |
205 |
1.79 |
14.15 |
85.486 |
10.830 |
T P |
| 1biq_B |
341 |
218 |
205 |
1.79 |
13.17 |
85.365 |
10.847 |
T P |
| 1h0o_A |
288 |
218 |
199 |
1.68 |
14.57 |
84.621 |
11.194 |
T P |
| 2rcc_A |
313 |
218 |
200 |
1.76 |
9.50 |
84.225 |
10.750 |
T P |
| 2uw2_A |
275 |
218 |
196 |
1.66 |
15.31 |
83.305 |
11.119 |
T P |
| 2iyh_A |
275 |
218 |
198 |
1.73 |
14.65 |
83.192 |
10.796 |
T P |
| 2p1i_A |
258 |
218 |
197 |
1.82 |
14.72 |
80.597 |
10.260 |
T P |
| 2vux_A |
272 |
218 |
193 |
1.83 |
15.03 |
80.209 |
10.012 |
T P |
| 1jk0_A |
334 |
218 |
197 |
1.85 |
13.71 |
78.226 |
10.118 |
T P |
| 2o1z_A |
288 |
218 |
191 |
1.77 |
15.18 |
77.574 |
10.237 |
T P |
| 1smq_A |
329 |
218 |
193 |
1.81 |
13.47 |
77.468 |
10.129 |
T P |
| 1jk0_B |
265 |
218 |
179 |
1.84 |
11.73 |
70.672 |
9.210 |
T P |
| 2inp_D |
328 |
218 |
183 |
2.42 |
11.48 |
55.964 |
7.264 |
T P |
| 2oc5_A |
222 |
218 |
171 |
2.22 |
11.70 |
54.565 |
7.365 |
T P |
| 1t0q_A |
491 |
218 |
176 |
2.27 |
15.34 |
54.552 |
7.424 |
T P |
| 2inp_A |
494 |
218 |
172 |
2.24 |
9.88 |
54.521 |
7.344 |
T P |
| 2inc_A |
491 |
218 |
173 |
2.26 |
12.72 |
53.686 |
7.338 |
T P |
| 3dhi_A |
498 |
218 |
171 |
2.19 |
10.53 |
53.536 |
7.478 |
T P |
| 2rdb_A |
491 |
218 |
172 |
2.26 |
13.37 |
52.858 |
7.288 |
T P |
| 3cht_A |
301 |
218 |
161 |
2.15 |
9.32 |
52.680 |
7.166 |
T P |
| 2jcd_A |
315 |
218 |
149 |
2.15 |
8.72 |
50.398 |
6.620 |
T P |
| 3ez0_A |
216 |
218 |
157 |
2.52 |
15.29 |
48.525 |
5.982 |
T P |
| 2uw1_B |
338 |
218 |
139 |
2.28 |
12.23 |
46.429 |
5.847 |
T P |
| 1otk_A |
244 |
218 |
145 |
2.29 |
12.41 |
45.878 |
6.073 |
T P |
| 1oq4_A |
346 |
218 |
134 |
2.13 |
11.94 |
45.579 |
6.004 |
T P |
| 1za0_A |
242 |
218 |
137 |
2.22 |
14.60 |
45.100 |
5.898 |
T P |
| 2j2f_A |
348 |
218 |
133 |
2.20 |
12.03 |
44.762 |
5.781 |
T P |
| 1afr_A |
345 |
218 |
138 |
2.31 |
11.59 |
44.691 |
5.735 |
T P |
| 3b3h_A |
161 |
218 |
117 |
2.06 |
13.68 |
42.950 |
5.420 |
T P |
| 2uw1_A |
327 |
218 |
151 |
2.46 |
7.28 |
42.786 |
5.899 |
T P |
| 2itb_A |
199 |
218 |
129 |
2.20 |
10.85 |
42.430 |
5.597 |
T P |
| 1nfv_B |
170 |
218 |
117 |
2.06 |
10.26 |
41.375 |
5.426 |
T P |
| 3fse_B |
349 |
218 |
106 |
2.31 |
11.32 |
35.920 |
4.392 |
T P |
| 2ppw_A |
210 |
218 |
44 |
2.48 |
4.55 |
14.341 |
1.704 |
T P |
NS : Total number of residues in Structure (rotated structure)
NT : Total number of residues in TARGET (frame of reference)
N : Total number of residues superimposed under 4.0 Angstrom distance cutoff
RMSD : RMS deviation calculated on all N residues superimposed under 4.0 Angstrom distance cutoff
Seq_Id : Sequence Identity. Percent of identical residues from the total of N aligned.
LGA_S : Structure similarity score calculated by internal LGA procedure (see LGA paper for details)
LGA_Q : Score (how tight is the superposition) calculated by the formula: Q = 0.1*N/(0.1+RMSD)
PLOTS : T - Flat text file (output from LGA program, rotated structure)
PLOTS : P - Plot of superimposed structures (3D plot colored as bars)
Citing LGA:
Zemla A., "LGA - a Method for Finding 3D Similarities in Protein Structures",
Nucleic Acids Research, 2003, Vol. 31, No. 13, pp. 3370-3374.
[MEDLINE]