LGA
Sequence Independent Analysis (LGA)
Frame of reference: Cat.Q2246_545_279.5wLII_11238_5
Total number of 3D structures: 62
LGA calculations using distance cutoff DIST: 4.0 A
Residues superimposed below 2.00 A: GREEN
Residues superimposed below 4.00 A: YELLOW
Residues superimposed below 6.00 A: ORANGE
Residues superimposed below 8.00 A: BROWN
Residues superimposed above 8.00 A or not aligned: RED
Terminal residues not aligned: GREY
Structure Deviation Summary
Calculations based on one final LGA superposition
(Bar representation of 3D plots, TEXT)
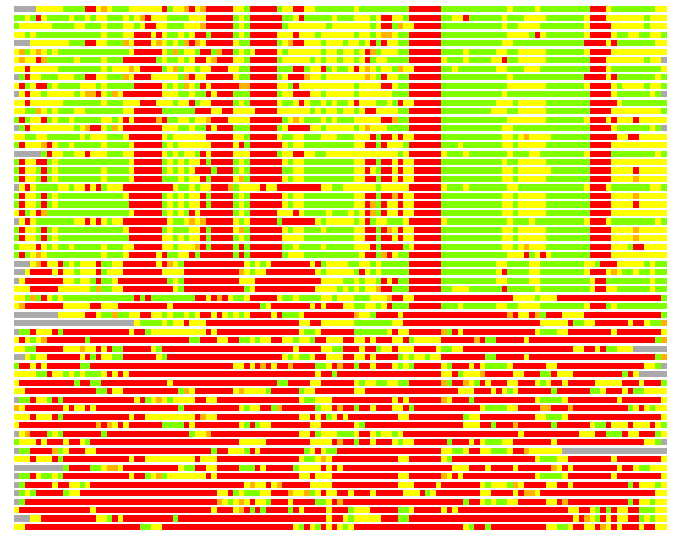
Structures ordered by LGA_S - score
| Structure |
NS |
NT |
N(dist=4.0) |
RMSD(N) |
Seq_ID(N) |
LGA_S |
LGA_Q |
PLOTS |
| 1mo9_A |
522 |
119 |
90 |
2.05 |
21.11 |
60.984 |
4.190 |
T P |
| 1f6m_A |
320 |
119 |
93 |
2.22 |
7.53 |
57.452 |
4.007 |
T P |
| 3cty_B |
305 |
119 |
95 |
2.27 |
13.68 |
57.094 |
4.014 |
T P |
| 2qae_A |
465 |
119 |
92 |
2.16 |
9.78 |
56.348 |
4.074 |
T P |
| 3cgb_A |
444 |
119 |
85 |
2.16 |
14.12 |
55.634 |
3.763 |
T P |
| 3lad_A |
472 |
119 |
95 |
2.39 |
10.53 |
55.145 |
3.809 |
T P |
| 2a8x_A |
464 |
119 |
90 |
2.32 |
10.00 |
55.091 |
3.722 |
T P |
| 1gte_D |
1014 |
119 |
94 |
2.25 |
6.38 |
54.681 |
4.002 |
T P |
| 3cgd_A |
444 |
119 |
86 |
2.22 |
13.95 |
54.679 |
3.702 |
T P |
| 1dxl_A |
467 |
119 |
87 |
2.30 |
17.24 |
54.488 |
3.628 |
T P |
| 1ger_B |
449 |
119 |
86 |
2.21 |
10.47 |
54.412 |
3.718 |
T P |
| 1h7x_B |
1019 |
119 |
92 |
2.20 |
9.78 |
54.404 |
3.992 |
T P |
| 1lpf_A |
472 |
119 |
93 |
2.36 |
8.60 |
54.168 |
3.779 |
T P |
| 2v6o_A |
586 |
119 |
89 |
2.34 |
13.48 |
53.795 |
3.643 |
T P |
| 1ges_B |
449 |
119 |
84 |
2.16 |
10.71 |
53.558 |
3.709 |
T P |
| 2r9z_B |
453 |
119 |
87 |
2.39 |
16.09 |
52.824 |
3.497 |
T P |
| 1grt_A |
462 |
119 |
88 |
2.31 |
12.50 |
52.619 |
3.646 |
T P |
| 1zmd_E |
473 |
119 |
85 |
2.18 |
12.94 |
52.212 |
3.726 |
T P |
| 1dnc_A |
461 |
119 |
86 |
2.22 |
12.79 |
52.195 |
3.712 |
T P |
| 3dk9_A |
462 |
119 |
86 |
2.21 |
12.79 |
52.013 |
3.724 |
T P |
| 3djg_X |
461 |
119 |
87 |
2.26 |
12.64 |
51.981 |
3.684 |
T P |
| 1zy8_A |
474 |
119 |
85 |
2.23 |
16.47 |
51.730 |
3.648 |
T P |
| 1xan_A |
461 |
119 |
86 |
2.24 |
12.79 |
51.647 |
3.678 |
T P |
| 1k4q_A |
459 |
119 |
87 |
2.25 |
12.64 |
51.617 |
3.699 |
T P |
| 1typ_A |
487 |
119 |
87 |
2.20 |
12.64 |
51.504 |
3.789 |
T P |
| 2yqu_A |
455 |
119 |
81 |
2.12 |
17.28 |
51.361 |
3.648 |
T P |
| 5grt_A |
461 |
119 |
87 |
2.25 |
12.64 |
51.291 |
3.705 |
T P |
| 1gsn_A |
461 |
119 |
86 |
2.24 |
12.79 |
51.228 |
3.679 |
T P |
| 2aaq_A |
461 |
119 |
85 |
2.29 |
12.94 |
51.125 |
3.551 |
T P |
| 2ve2_B |
488 |
119 |
83 |
2.18 |
13.25 |
50.706 |
3.636 |
T P |
| 3f8d_B |
309 |
119 |
78 |
2.27 |
17.95 |
48.599 |
3.291 |
T P |
| 3f8p_D |
310 |
119 |
74 |
2.21 |
16.22 |
48.116 |
3.200 |
T P |
| 1vdc_A |
322 |
119 |
69 |
1.99 |
10.14 |
47.254 |
3.298 |
T P |
| 2a87_A |
313 |
119 |
72 |
2.12 |
11.11 |
46.616 |
3.241 |
T P |
| 2zbw_B |
334 |
119 |
68 |
2.21 |
10.29 |
44.453 |
2.948 |
T P |
| 2q0l_A |
311 |
119 |
64 |
2.20 |
14.06 |
43.569 |
2.779 |
T P |
| 1gvi_A |
588 |
119 |
48 |
2.68 |
6.25 |
25.403 |
1.726 |
T P |
| 2fhf_A |
1052 |
119 |
43 |
2.60 |
6.98 |
24.012 |
1.592 |
T P |
| 1ji2_A |
585 |
119 |
43 |
2.49 |
6.98 |
23.492 |
1.659 |
T P |
| 1vfo_A |
585 |
119 |
42 |
2.67 |
7.14 |
22.910 |
1.517 |
T P |
| 1sma_A |
588 |
119 |
40 |
2.61 |
7.50 |
21.846 |
1.478 |
T P |
| 2d2o_A |
585 |
119 |
37 |
2.55 |
10.81 |
21.819 |
1.394 |
T P |
| 1izk_A |
637 |
119 |
35 |
2.62 |
5.71 |
21.523 |
1.287 |
T P |
| 1bf2_A |
750 |
119 |
36 |
2.65 |
2.78 |
21.239 |
1.311 |
T P |
| 2z1k_A |
474 |
119 |
38 |
2.60 |
5.26 |
21.133 |
1.410 |
T P |
| 2d0f_A |
637 |
119 |
39 |
2.75 |
7.69 |
21.047 |
1.368 |
T P |
| 1wzk_A |
585 |
119 |
37 |
2.63 |
8.11 |
20.963 |
1.358 |
T P |
| 1g1y_A |
585 |
119 |
38 |
2.84 |
7.89 |
20.916 |
1.291 |
T P |
| 1wzm_A |
585 |
119 |
38 |
2.80 |
5.26 |
20.861 |
1.311 |
T P |
| 1izj_A |
637 |
119 |
36 |
2.68 |
13.89 |
20.776 |
1.296 |
T P |
| 1j0h_A |
588 |
119 |
37 |
2.58 |
8.11 |
20.752 |
1.382 |
T P |
| 1uh4_A |
637 |
119 |
36 |
2.83 |
5.56 |
20.662 |
1.227 |
T P |
| 1ea9_C |
583 |
119 |
36 |
2.76 |
5.56 |
20.524 |
1.258 |
T P |
| 1jf6_A |
585 |
119 |
38 |
2.74 |
7.89 |
20.493 |
1.340 |
T P |
| 1ji1_A |
637 |
119 |
38 |
2.67 |
5.26 |
20.238 |
1.374 |
T P |
| 1wzl_A |
585 |
119 |
38 |
2.70 |
2.63 |
20.143 |
1.357 |
T P |
| 1jf5_A |
585 |
119 |
37 |
2.99 |
5.41 |
20.012 |
1.196 |
T P |
| 2e8y_A |
712 |
119 |
38 |
2.97 |
7.89 |
19.926 |
1.239 |
T P |
| 1j0j_A |
588 |
119 |
32 |
2.80 |
3.12 |
18.650 |
1.104 |
T P |
| 1eha_A |
557 |
119 |
31 |
2.74 |
6.45 |
18.412 |
1.092 |
T P |
| 1eh9_A |
557 |
119 |
29 |
2.65 |
10.34 |
18.218 |
1.055 |
T P |
| 2vr5_A |
715 |
119 |
30 |
2.77 |
10.00 |
16.432 |
1.045 |
T P |
NS : Total number of residues in Structure (rotated structure)
NT : Total number of residues in TARGET (frame of reference)
N : Total number of residues superimposed under 4.0 Angstrom distance cutoff
RMSD : RMS deviation calculated on all N residues superimposed under 4.0 Angstrom distance cutoff
Seq_Id : Sequence Identity. Percent of identical residues from the total of N aligned.
LGA_S : Structure similarity score calculated by internal LGA procedure (see LGA paper for details)
LGA_Q : Score (how tight is the superposition) calculated by the formula: Q = 0.1*N/(0.1+RMSD)
PLOTS : T - Flat text file (output from LGA program, rotated structure)
PLOTS : P - Plot of superimposed structures (3D plot colored as bars)
Citing LGA:
Zemla A., "LGA - a Method for Finding 3D Similarities in Protein Structures",
Nucleic Acids Research, 2003, Vol. 31, No. 13, pp. 3370-3374.
[MEDLINE]