LGA
Sequence Independent Analysis (LGA)
Frame of reference: Cat.Q2246_545_295.5wLII_11238_48
Total number of 3D structures: 11
LGA calculations using distance cutoff DIST: 4.0 A
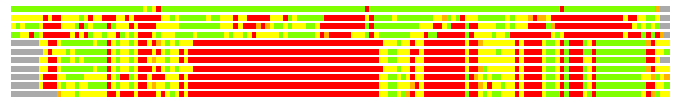
Residues superimposed below 2.00 A: GREEN
Residues superimposed below 4.00 A: YELLOW
Residues superimposed below 6.00 A: ORANGE
Residues superimposed below 8.00 A: BROWN
Residues superimposed above 8.00 A or not aligned: RED
Terminal residues not aligned: GREY
Structure Deviation Summary
Calculations based on one final LGA superposition
(Bar representation of 3D plots, TEXT)
Structures ordered by LGA_S - score
| Structure |
NS |
NT |
N(dist=4.0) |
RMSD(N) |
Seq_ID(N) |
LGA_S |
LGA_Q |
PLOTS |
| 1xax_A |
144 |
145 |
140 |
0.63 |
27.86 |
95.780 |
19.219 |
T P |
| 1xm5_A |
152 |
145 |
92 |
2.44 |
21.74 |
42.710 |
3.626 |
T P |
| 1oz9_A |
141 |
145 |
88 |
2.37 |
23.86 |
40.664 |
3.568 |
T P |
| 1tvi_A |
150 |
145 |
88 |
2.43 |
22.73 |
40.039 |
3.472 |
T P |
| 6r1r_A |
738 |
145 |
68 |
2.39 |
8.82 |
30.538 |
2.733 |
T P |
| 1r1r_A |
734 |
145 |
64 |
2.29 |
7.81 |
30.345 |
2.674 |
T P |
| 7r1r_A |
738 |
145 |
65 |
2.34 |
6.15 |
30.344 |
2.660 |
T P |
| 5r1r_A |
738 |
145 |
67 |
2.37 |
8.96 |
30.168 |
2.712 |
T P |
| 2r1r_A |
733 |
145 |
64 |
2.45 |
6.25 |
29.923 |
2.507 |
T P |
| 4r1r_A |
733 |
145 |
65 |
2.40 |
4.62 |
29.628 |
2.597 |
T P |
| 1rlr_A |
737 |
145 |
59 |
2.47 |
6.78 |
27.313 |
2.297 |
T P |
NS : Total number of residues in Structure (rotated structure)
NT : Total number of residues in TARGET (frame of reference)
N : Total number of residues superimposed under 4.0 Angstrom distance cutoff
RMSD : RMS deviation calculated on all N residues superimposed under 4.0 Angstrom distance cutoff
Seq_Id : Sequence Identity. Percent of identical residues from the total of N aligned.
LGA_S : Structure similarity score calculated by internal LGA procedure (see LGA paper for details)
LGA_Q : Score (how tight is the superposition) calculated by the formula: Q = 0.1*N/(0.1+RMSD)
PLOTS : T - Flat text file (output from LGA program, rotated structure)
PLOTS : P - Plot of superimposed structures (3D plot colored as bars)
Citing LGA:
Zemla A., "LGA - a Method for Finding 3D Similarities in Protein Structures",
Nucleic Acids Research, 2003, Vol. 31, No. 13, pp. 3370-3374.
[MEDLINE]