LGA
Sequence Independent Analysis (LGA)
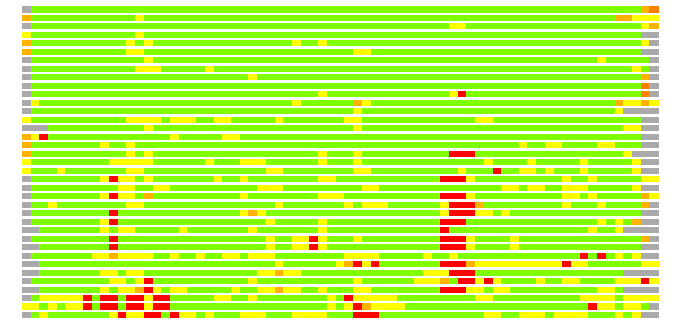
Frame of reference: Cat.Q2246_545_306.5wLII_11238_88
Total number of 3D structures: 37
LGA calculations using distance cutoff DIST: 4.0 A
Residues superimposed below 2.00 A: GREEN
Residues superimposed below 4.00 A: YELLOW
Residues superimposed below 6.00 A: ORANGE
Residues superimposed below 8.00 A: BROWN
Residues superimposed above 8.00 A or not aligned: RED
Terminal residues not aligned: GREY
Structure Deviation Summary
Calculations based on one final LGA superposition
(Bar representation of 3D plots, TEXT)

Structures ordered by LGA_S - score
| Structure |
NS |
NT |
N(dist=4.0) |
RMSD(N) |
Seq_ID(N) |
LGA_S |
LGA_Q |
PLOTS |
| 1kqk_A |
80 |
73 |
72 |
1.08 |
20.83 |
98.348 |
6.125 |
T P |
| 1p6t_A |
151 |
73 |
73 |
1.39 |
16.44 |
95.969 |
4.885 |
T P |
| 1yjr_A |
75 |
73 |
72 |
1.30 |
12.50 |
94.274 |
5.156 |
T P |
| 1yju_A |
75 |
73 |
71 |
1.10 |
12.68 |
94.202 |
5.904 |
T P |
| 2ew9_A |
149 |
73 |
72 |
1.39 |
16.67 |
94.166 |
4.822 |
T P |
| 1jww_A |
80 |
73 |
71 |
1.25 |
21.13 |
93.691 |
5.277 |
T P |
| 1osd_A |
72 |
73 |
71 |
1.10 |
23.94 |
93.529 |
5.919 |
T P |
| 1opz_A |
76 |
73 |
71 |
1.26 |
16.90 |
93.127 |
5.206 |
T P |
| 1aw0_A |
72 |
73 |
71 |
1.29 |
12.68 |
92.952 |
5.097 |
T P |
| 3cjk_B |
75 |
73 |
71 |
1.37 |
14.08 |
92.856 |
4.843 |
T P |
| 1fvq_A |
72 |
73 |
70 |
1.25 |
12.86 |
92.562 |
5.167 |
T P |
| 2rml_A |
147 |
73 |
72 |
1.58 |
16.67 |
92.123 |
4.285 |
T P |
| 2qif_A |
69 |
73 |
68 |
0.92 |
23.53 |
91.234 |
6.682 |
T P |
| 1s6o_A |
76 |
73 |
71 |
1.58 |
9.86 |
89.972 |
4.220 |
T P |
| 1cpz_A |
68 |
73 |
68 |
1.22 |
14.71 |
89.005 |
5.148 |
T P |
| 2rop_A |
142 |
73 |
70 |
1.48 |
14.29 |
88.566 |
4.431 |
T P |
| 1kvi_A |
79 |
73 |
71 |
1.61 |
14.08 |
88.176 |
4.141 |
T P |
| 1mwy_A |
73 |
73 |
67 |
1.35 |
16.42 |
88.176 |
4.615 |
T P |
| 1y3j_A |
77 |
73 |
71 |
1.82 |
11.27 |
88.145 |
3.705 |
T P |
| 2ofg_X |
106 |
73 |
70 |
1.64 |
15.71 |
87.040 |
4.022 |
T P |
| 1qup_A |
221 |
73 |
68 |
1.55 |
16.18 |
86.746 |
4.127 |
T P |
| 1afi_A |
72 |
73 |
70 |
1.66 |
22.86 |
86.440 |
3.974 |
T P |
| 1jk9_B |
243 |
73 |
68 |
1.68 |
16.18 |
86.013 |
3.827 |
T P |
| 2g9o_A |
77 |
73 |
68 |
1.75 |
14.71 |
85.310 |
3.667 |
T P |
| 2crl_A |
98 |
73 |
66 |
1.51 |
22.73 |
85.292 |
4.111 |
T P |
| 1cc8_A |
72 |
73 |
66 |
1.46 |
15.15 |
85.220 |
4.226 |
T P |
| 1yg0_A |
66 |
73 |
66 |
1.40 |
15.15 |
84.451 |
4.396 |
T P |
| 1fe0_B |
68 |
73 |
66 |
1.59 |
12.12 |
83.856 |
3.907 |
T P |
| 3cjk_A |
68 |
73 |
64 |
1.39 |
12.50 |
82.817 |
4.302 |
T P |
| 1k0v_A |
73 |
73 |
68 |
1.94 |
23.53 |
82.273 |
3.340 |
T P |
| 2aj0_A |
71 |
73 |
65 |
1.90 |
20.00 |
80.653 |
3.254 |
T P |
| 2k2p_A |
64 |
73 |
64 |
1.70 |
12.50 |
80.437 |
3.553 |
T P |
| 2gcf_A |
73 |
73 |
67 |
1.75 |
20.90 |
80.068 |
3.625 |
T P |
| 1sb6_A |
64 |
73 |
63 |
2.00 |
22.22 |
75.168 |
2.995 |
T P |
| 3bqe_A |
169 |
73 |
64 |
2.14 |
18.75 |
73.535 |
2.857 |
T P |
| 2j89_A |
183 |
73 |
63 |
1.97 |
20.63 |
72.801 |
3.042 |
T P |
| 1q8l_A |
84 |
73 |
63 |
2.08 |
9.52 |
65.527 |
2.889 |
T P |
NS : Total number of residues in Structure (rotated structure)
NT : Total number of residues in TARGET (frame of reference)
N : Total number of residues superimposed under 4.0 Angstrom distance cutoff
RMSD : RMS deviation calculated on all N residues superimposed under 4.0 Angstrom distance cutoff
Seq_Id : Sequence Identity. Percent of identical residues from the total of N aligned.
LGA_S : Structure similarity score calculated by internal LGA procedure (see LGA paper for details)
LGA_Q : Score (how tight is the superposition) calculated by the formula: Q = 0.1*N/(0.1+RMSD)
PLOTS : T - Flat text file (output from LGA program, rotated structure)
PLOTS : P - Plot of superimposed structures (3D plot colored as bars)
Citing LGA:
Zemla A., "LGA - a Method for Finding 3D Similarities in Protein Structures",
Nucleic Acids Research, 2003, Vol. 31, No. 13, pp. 3370-3374.
[MEDLINE]

