LGA
Sequence Independent Analysis (LGA)
Frame of reference: Cat.Q2246_545_328.5wLII_11276_48
Total number of 3D structures: 53
LGA calculations using distance cutoff DIST: 4.0 A
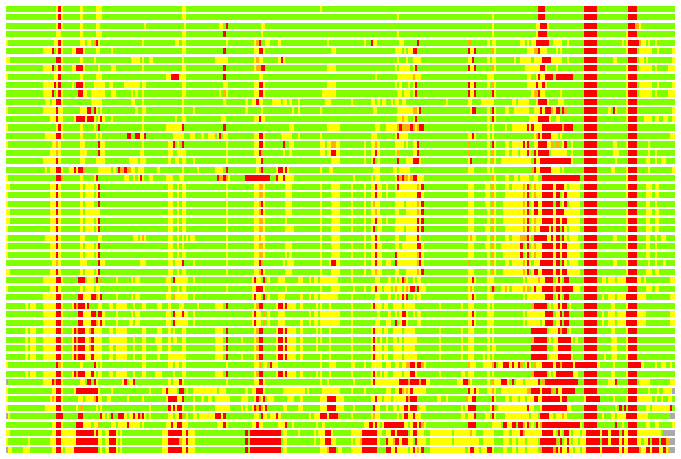
Residues superimposed below 2.00 A: GREEN
Residues superimposed below 4.00 A: YELLOW
Residues superimposed below 6.00 A: ORANGE
Residues superimposed below 8.00 A: BROWN
Residues superimposed above 8.00 A or not aligned: RED
Terminal residues not aligned: GREY
Structure Deviation Summary
Calculations based on one final LGA superposition
(Bar representation of 3D plots, TEXT)
Structures ordered by LGA_S - score
| Structure |
NS |
NT |
N(dist=4.0) |
RMSD(N) |
Seq_ID(N) |
LGA_S |
LGA_Q |
PLOTS |
| 1r66_A |
322 |
304 |
290 |
0.69 |
23.45 |
94.613 |
36.753 |
T P |
| 1r6d_A |
322 |
304 |
290 |
0.69 |
23.45 |
94.559 |
36.941 |
T P |
| 1oc2_B |
346 |
304 |
290 |
1.05 |
18.62 |
92.548 |
25.153 |
T P |
| 1kew_A |
361 |
304 |
289 |
1.01 |
17.65 |
92.359 |
25.987 |
T P |
| 1gy8_C |
370 |
304 |
282 |
1.58 |
20.57 |
86.187 |
16.807 |
T P |
| 1t2a_A |
338 |
304 |
281 |
1.54 |
13.17 |
85.894 |
17.162 |
T P |
| 1sb8_A |
341 |
304 |
286 |
1.61 |
14.34 |
85.630 |
16.683 |
T P |
| 1n7h_B |
334 |
304 |
281 |
1.55 |
13.17 |
85.512 |
17.007 |
T P |
| 1bxk_B |
344 |
304 |
275 |
1.47 |
19.27 |
85.487 |
17.506 |
T P |
| 1rpn_C |
322 |
304 |
282 |
1.61 |
14.18 |
85.086 |
16.450 |
T P |
| 2z1m_A |
338 |
304 |
283 |
1.62 |
13.07 |
85.031 |
16.437 |
T P |
| 1orr_A |
338 |
304 |
287 |
1.70 |
14.63 |
84.713 |
15.918 |
T P |
| 2p5y_A |
311 |
304 |
278 |
1.69 |
19.42 |
84.629 |
15.544 |
T P |
| 2pk3_A |
309 |
304 |
277 |
1.56 |
15.16 |
84.466 |
16.673 |
T P |
| 2hun_A |
329 |
304 |
271 |
1.73 |
17.71 |
84.016 |
14.791 |
T P |
| 2b69_A |
312 |
304 |
277 |
1.59 |
18.77 |
83.848 |
16.373 |
T P |
| 1i3k_A |
347 |
304 |
279 |
1.81 |
16.13 |
83.792 |
14.615 |
T P |
| 1ek6_A |
346 |
304 |
281 |
1.79 |
16.73 |
83.785 |
14.842 |
T P |
| 1z45_A |
674 |
304 |
271 |
1.72 |
17.71 |
81.514 |
14.898 |
T P |
| 1z7e_D |
644 |
304 |
276 |
1.81 |
15.94 |
81.318 |
14.440 |
T P |
| 2q1s_A |
336 |
304 |
254 |
1.70 |
18.50 |
78.630 |
14.104 |
T P |
| 1kvu_A |
338 |
304 |
279 |
1.87 |
17.56 |
77.585 |
14.164 |
T P |
| 1a9y_A |
338 |
304 |
280 |
1.86 |
17.50 |
77.516 |
14.256 |
T P |
| 1kvs_A |
338 |
304 |
279 |
1.85 |
17.56 |
77.513 |
14.329 |
T P |
| 1a9z_A |
338 |
304 |
279 |
1.87 |
17.56 |
77.500 |
14.145 |
T P |
| 1udb_A |
338 |
304 |
279 |
1.88 |
17.56 |
77.493 |
14.099 |
T P |
| 1kvq_A |
338 |
304 |
280 |
1.86 |
17.50 |
77.445 |
14.294 |
T P |
| 3enk_A |
340 |
304 |
280 |
1.87 |
17.86 |
77.307 |
14.200 |
T P |
| 1kvt_A |
338 |
304 |
278 |
1.86 |
16.91 |
77.303 |
14.198 |
T P |
| 1kvr_A |
338 |
304 |
278 |
1.87 |
16.91 |
77.174 |
14.136 |
T P |
| 1hzj_A |
345 |
304 |
276 |
1.82 |
16.67 |
77.163 |
14.340 |
T P |
| 1udc_A |
338 |
304 |
278 |
1.89 |
17.63 |
77.038 |
13.998 |
T P |
| 2c54_A |
362 |
304 |
275 |
1.89 |
16.73 |
76.887 |
13.834 |
T P |
| 1lrk_A |
338 |
304 |
272 |
1.88 |
17.28 |
76.102 |
13.751 |
T P |
| 2c5a_A |
363 |
304 |
274 |
1.92 |
16.79 |
75.610 |
13.576 |
T P |
| 1z75_A |
334 |
304 |
271 |
1.86 |
16.24 |
75.438 |
13.845 |
T P |
| 2c5e_A |
362 |
304 |
272 |
1.89 |
16.91 |
75.204 |
13.672 |
T P |
| 2c59_A |
364 |
304 |
273 |
1.93 |
16.48 |
75.093 |
13.467 |
T P |
| 1z7b_A |
334 |
304 |
270 |
1.88 |
14.44 |
74.651 |
13.603 |
T P |
| 1u9j_A |
332 |
304 |
268 |
1.88 |
14.93 |
74.205 |
13.547 |
T P |
| 1z73_A |
332 |
304 |
267 |
1.87 |
14.61 |
73.692 |
13.528 |
T P |
| 2bll_A |
330 |
304 |
267 |
1.89 |
14.98 |
73.617 |
13.434 |
T P |
| 2c20_A |
329 |
304 |
262 |
1.89 |
18.32 |
73.057 |
13.151 |
T P |
| 1z74_A |
326 |
304 |
264 |
1.88 |
14.77 |
72.911 |
13.351 |
T P |
| 3ehe_A |
290 |
304 |
248 |
1.88 |
17.74 |
64.926 |
12.517 |
T P |
| 1db3_A |
335 |
304 |
256 |
2.04 |
16.80 |
64.257 |
11.986 |
T P |
| 2pzm_A |
316 |
304 |
260 |
2.05 |
15.77 |
64.240 |
12.066 |
T P |
| 2q1w_A |
300 |
304 |
255 |
1.96 |
19.22 |
63.734 |
12.398 |
T P |
| 1eq2_D |
307 |
304 |
254 |
2.06 |
13.78 |
58.922 |
11.767 |
T P |
| 2c29_F |
326 |
304 |
237 |
1.91 |
18.99 |
57.064 |
11.803 |
T P |
| 2jl1_A |
287 |
304 |
217 |
2.33 |
16.59 |
48.310 |
8.942 |
T P |
| 2vrc_A |
285 |
304 |
216 |
2.31 |
18.52 |
47.732 |
8.957 |
T P |
| 2vrb_A |
284 |
304 |
210 |
2.33 |
16.67 |
46.873 |
8.641 |
T P |
NS : Total number of residues in Structure (rotated structure)
NT : Total number of residues in TARGET (frame of reference)
N : Total number of residues superimposed under 4.0 Angstrom distance cutoff
RMSD : RMS deviation calculated on all N residues superimposed under 4.0 Angstrom distance cutoff
Seq_Id : Sequence Identity. Percent of identical residues from the total of N aligned.
LGA_S : Structure similarity score calculated by internal LGA procedure (see LGA paper for details)
LGA_Q : Score (how tight is the superposition) calculated by the formula: Q = 0.1*N/(0.1+RMSD)
PLOTS : T - Flat text file (output from LGA program, rotated structure)
PLOTS : P - Plot of superimposed structures (3D plot colored as bars)
Citing LGA:
Zemla A., "LGA - a Method for Finding 3D Similarities in Protein Structures",
Nucleic Acids Research, 2003, Vol. 31, No. 13, pp. 3370-3374.
[MEDLINE]