LGA
Sequence Independent Analysis (LGA)
Frame of reference: Cat.Q2246_545_337.5wLII_11276_107
Total number of 3D structures: 15
LGA calculations using distance cutoff DIST: 4.0 A
Residues superimposed below 2.00 A: GREEN
Residues superimposed below 4.00 A: YELLOW
Residues superimposed below 6.00 A: ORANGE
Residues superimposed below 8.00 A: BROWN
Residues superimposed above 8.00 A or not aligned: RED
Terminal residues not aligned: GREY
Structure Deviation Summary
Calculations based on one final LGA superposition
(Bar representation of 3D plots, TEXT)
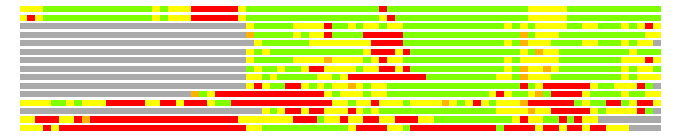
Structures ordered by LGA_S - score
| Structure |
NS |
NT |
N(dist=4.0) |
RMSD(N) |
Seq_ID(N) |
LGA_S |
LGA_Q |
PLOTS |
| 2bh7_A |
254 |
82 |
75 |
1.46 |
25.33 |
86.591 |
4.807 |
T P |
| 2bgx_A |
254 |
82 |
74 |
1.47 |
27.03 |
86.216 |
4.718 |
T P |
| 1ck7_A |
619 |
82 |
51 |
1.94 |
15.69 |
54.621 |
2.500 |
T P |
| 1su3_B |
416 |
82 |
47 |
1.84 |
31.91 |
51.508 |
2.427 |
T P |
| 1slm_A |
226 |
82 |
47 |
2.03 |
31.91 |
49.916 |
2.207 |
T P |
| 3bkh_A |
268 |
82 |
49 |
1.73 |
22.45 |
49.799 |
2.671 |
T P |
| 1eak_A |
421 |
82 |
51 |
2.16 |
17.65 |
49.726 |
2.255 |
T P |
| 1lbu_A |
213 |
82 |
48 |
2.08 |
27.08 |
46.881 |
2.197 |
T P |
| 1l6j_A |
405 |
82 |
43 |
1.92 |
27.91 |
46.464 |
2.127 |
T P |
| 2ikb_A |
163 |
82 |
41 |
2.22 |
0.00 |
39.684 |
1.768 |
T P |
| 2nr7_A |
194 |
82 |
41 |
2.14 |
4.88 |
38.342 |
1.834 |
T P |
| 2zat_A |
251 |
82 |
47 |
2.74 |
10.64 |
35.886 |
1.653 |
T P |
| 2is5_A |
160 |
82 |
39 |
2.36 |
0.00 |
35.429 |
1.588 |
T P |
| 1ea0_A |
1452 |
82 |
39 |
2.53 |
5.13 |
33.684 |
1.482 |
T P |
| 1qap_A |
289 |
82 |
28 |
2.20 |
14.29 |
27.697 |
1.220 |
T P |
NS : Total number of residues in Structure (rotated structure)
NT : Total number of residues in TARGET (frame of reference)
N : Total number of residues superimposed under 4.0 Angstrom distance cutoff
RMSD : RMS deviation calculated on all N residues superimposed under 4.0 Angstrom distance cutoff
Seq_Id : Sequence Identity. Percent of identical residues from the total of N aligned.
LGA_S : Structure similarity score calculated by internal LGA procedure (see LGA paper for details)
LGA_Q : Score (how tight is the superposition) calculated by the formula: Q = 0.1*N/(0.1+RMSD)
PLOTS : T - Flat text file (output from LGA program, rotated structure)
PLOTS : P - Plot of superimposed structures (3D plot colored as bars)
Citing LGA:
Zemla A., "LGA - a Method for Finding 3D Similarities in Protein Structures",
Nucleic Acids Research, 2003, Vol. 31, No. 13, pp. 3370-3374.
[MEDLINE]