LGA
Sequence Independent Analysis (LGA)
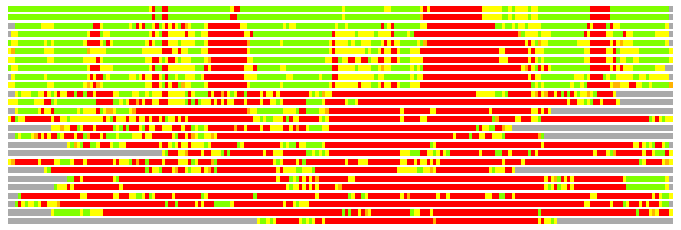
Frame of reference: Cat.Q2246_545_345.5wLII_11276_136
Total number of 3D structures: 26
LGA calculations using distance cutoff DIST: 4.0 A
Residues superimposed below 2.00 A: GREEN
Residues superimposed below 4.00 A: YELLOW
Residues superimposed below 6.00 A: ORANGE
Residues superimposed below 8.00 A: BROWN
Residues superimposed above 8.00 A or not aligned: RED
Terminal residues not aligned: GREY
Structure Deviation Summary
Calculations based on one final LGA superposition
(Bar representation of 3D plots, TEXT)

Structures ordered by LGA_S - score
| Structure |
NS |
NT |
N(dist=4.0) |
RMSD(N) |
Seq_ID(N) |
LGA_S |
LGA_Q |
PLOTS |
| 3ckj_A |
300 |
203 |
174 |
1.13 |
15.52 |
83.323 |
14.168 |
T P |
| 3e26_A |
274 |
203 |
173 |
1.03 |
17.92 |
83.081 |
15.376 |
T P |
| 2bo4_A |
380 |
203 |
153 |
1.78 |
5.23 |
62.596 |
8.124 |
T P |
| 3bcv_A |
196 |
203 |
141 |
2.06 |
14.89 |
54.237 |
6.543 |
T P |
| 2z86_C |
603 |
203 |
141 |
1.97 |
12.06 |
52.945 |
6.811 |
T P |
| 2ffu_A |
494 |
203 |
145 |
2.11 |
11.72 |
52.837 |
6.567 |
T P |
| 2d7i_A |
536 |
203 |
141 |
2.04 |
12.77 |
52.827 |
6.598 |
T P |
| 2z87_A |
601 |
203 |
140 |
2.06 |
11.43 |
50.961 |
6.484 |
T P |
| 1qg8_A |
238 |
203 |
143 |
2.16 |
11.89 |
49.192 |
6.317 |
T P |
| 1xhb_A |
447 |
203 |
137 |
2.16 |
11.68 |
48.743 |
6.049 |
T P |
| 3bq9_A |
446 |
203 |
85 |
2.63 |
10.59 |
26.526 |
3.115 |
T P |
| 3gh1_A |
448 |
203 |
73 |
2.40 |
9.59 |
24.372 |
2.921 |
T P |
| 3g1w_A |
291 |
203 |
65 |
2.38 |
7.69 |
22.686 |
2.621 |
T P |
| 2b0t_A |
735 |
203 |
65 |
2.83 |
9.23 |
22.113 |
2.217 |
T P |
| 2fav_A |
172 |
203 |
50 |
2.69 |
8.00 |
16.841 |
1.791 |
T P |
| 3ez1_B |
419 |
203 |
49 |
2.54 |
2.04 |
16.747 |
1.855 |
T P |
| 2acf_D |
179 |
203 |
51 |
2.56 |
3.92 |
16.623 |
1.914 |
T P |
| 3cv0_A |
300 |
203 |
50 |
2.66 |
6.00 |
15.919 |
1.812 |
T P |
| 1ump_A |
619 |
203 |
48 |
2.84 |
4.17 |
15.829 |
1.634 |
T P |
| 1w3b_A |
388 |
203 |
45 |
2.73 |
4.44 |
13.318 |
1.588 |
T P |
| 1na0_A |
119 |
203 |
34 |
2.35 |
0.00 |
12.558 |
1.388 |
T P |
| 1na3_A |
86 |
203 |
35 |
2.55 |
5.71 |
12.499 |
1.320 |
T P |
| 1q9h_A |
430 |
203 |
37 |
2.80 |
5.41 |
12.194 |
1.276 |
T P |
| 3cvq_A |
289 |
203 |
37 |
2.61 |
10.81 |
11.952 |
1.365 |
T P |
| 2fo7_A |
136 |
203 |
31 |
2.42 |
3.23 |
11.509 |
1.229 |
T P |
| 2avp_A |
68 |
203 |
18 |
2.68 |
5.56 |
6.479 |
0.648 |
T P |
NS : Total number of residues in Structure (rotated structure)
NT : Total number of residues in TARGET (frame of reference)
N : Total number of residues superimposed under 4.0 Angstrom distance cutoff
RMSD : RMS deviation calculated on all N residues superimposed under 4.0 Angstrom distance cutoff
Seq_Id : Sequence Identity. Percent of identical residues from the total of N aligned.
LGA_S : Structure similarity score calculated by internal LGA procedure (see LGA paper for details)
LGA_Q : Score (how tight is the superposition) calculated by the formula: Q = 0.1*N/(0.1+RMSD)
PLOTS : T - Flat text file (output from LGA program, rotated structure)
PLOTS : P - Plot of superimposed structures (3D plot colored as bars)
Citing LGA:
Zemla A., "LGA - a Method for Finding 3D Similarities in Protein Structures",
Nucleic Acids Research, 2003, Vol. 31, No. 13, pp. 3370-3374.
[MEDLINE]

