LGA
Sequence Independent Analysis (LGA)
Frame of reference: Cat.Q2246_545_362.5wLII_11277_20
Total number of 3D structures: 68
LGA calculations using distance cutoff DIST: 4.0 A
Residues superimposed below 2.00 A: GREEN
Residues superimposed below 4.00 A: YELLOW
Residues superimposed below 6.00 A: ORANGE
Residues superimposed below 8.00 A: BROWN
Residues superimposed above 8.00 A or not aligned: RED
Terminal residues not aligned: GREY
Structure Deviation Summary
Calculations based on one final LGA superposition
(Bar representation of 3D plots, TEXT)
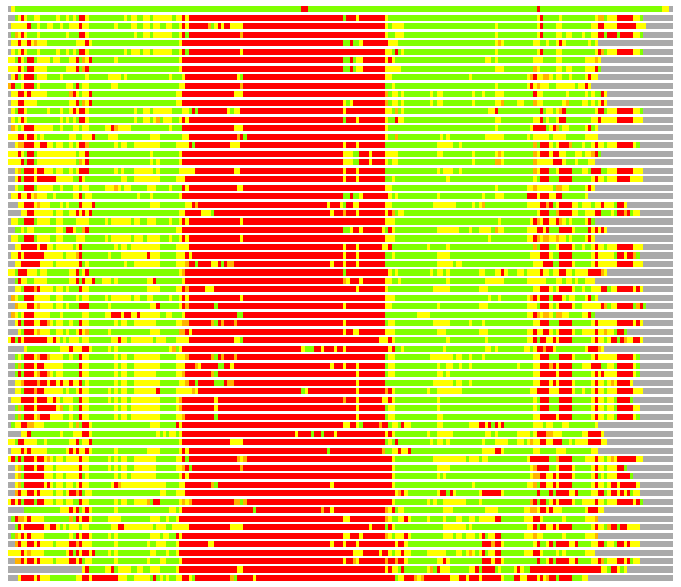
Structures ordered by LGA_S - score
| Structure |
NS |
NT |
N(dist=4.0) |
RMSD(N) |
Seq_ID(N) |
LGA_S |
LGA_Q |
PLOTS |
| 1wd5_A |
208 |
206 |
201 |
0.41 |
38.31 |
97.473 |
39.097 |
T P |
| 2e55_A |
208 |
206 |
126 |
1.81 |
21.43 |
55.370 |
6.605 |
T P |
| 1i5e_A |
208 |
206 |
132 |
1.96 |
17.42 |
55.032 |
6.398 |
T P |
| 1o5o_A |
210 |
206 |
122 |
1.84 |
19.67 |
52.984 |
6.301 |
T P |
| 1zn8_B |
179 |
206 |
119 |
1.78 |
23.53 |
52.957 |
6.326 |
T P |
| 2ehj_A |
208 |
206 |
124 |
1.91 |
16.13 |
52.589 |
6.171 |
T P |
| 1l1q_A |
181 |
206 |
120 |
1.94 |
15.83 |
52.241 |
5.896 |
T P |
| 2dy0_A |
182 |
206 |
120 |
1.88 |
23.33 |
52.027 |
6.046 |
T P |
| 1dku_A |
295 |
206 |
116 |
1.89 |
18.97 |
50.677 |
5.843 |
T P |
| 1u9y_A |
274 |
206 |
113 |
1.77 |
21.24 |
50.502 |
6.027 |
T P |
| 2fxv_A |
190 |
206 |
118 |
1.95 |
16.10 |
50.355 |
5.764 |
T P |
| 1y0b_D |
194 |
206 |
120 |
1.97 |
15.00 |
49.338 |
5.803 |
T P |
| 3dmp_A |
214 |
206 |
127 |
1.94 |
16.54 |
48.105 |
6.211 |
T P |
| 1v9s_B |
208 |
206 |
123 |
1.93 |
15.45 |
47.899 |
6.069 |
T P |
| 2ji4_A |
302 |
206 |
112 |
1.92 |
16.07 |
47.792 |
5.556 |
T P |
| 2aee_A |
206 |
206 |
119 |
2.02 |
21.01 |
47.584 |
5.606 |
T P |
| 1j7j_B |
164 |
206 |
120 |
2.14 |
16.67 |
47.548 |
5.367 |
T P |
| 1mzv_A |
216 |
206 |
117 |
2.08 |
20.51 |
47.492 |
5.373 |
T P |
| 1qb7_A |
236 |
206 |
118 |
2.15 |
17.80 |
47.361 |
5.248 |
T P |
| 1g9s_A |
169 |
206 |
117 |
2.05 |
17.09 |
47.274 |
5.444 |
T P |
| 1pzm_A |
170 |
206 |
112 |
1.91 |
15.18 |
47.132 |
5.583 |
T P |
| 2c4k_A |
305 |
206 |
116 |
2.12 |
13.79 |
47.043 |
5.229 |
T P |
| 1g2q_A |
178 |
206 |
109 |
1.83 |
19.27 |
45.654 |
5.640 |
T P |
| 1w30_B |
177 |
206 |
120 |
2.10 |
20.83 |
45.310 |
5.445 |
T P |
| 1vdm_G |
152 |
206 |
119 |
1.95 |
24.37 |
44.896 |
5.798 |
T P |
| 2h08_B |
308 |
206 |
112 |
2.03 |
16.96 |
44.857 |
5.270 |
T P |
| 1vch_D |
173 |
206 |
112 |
1.89 |
18.75 |
44.696 |
5.627 |
T P |
| 2h06_B |
308 |
206 |
115 |
2.15 |
17.39 |
44.578 |
5.100 |
T P |
| 2ywu_A |
164 |
206 |
115 |
2.12 |
14.78 |
44.477 |
5.190 |
T P |
| 1hgx_A |
164 |
206 |
115 |
2.22 |
15.65 |
43.848 |
4.953 |
T P |
| 1yfz_A |
178 |
206 |
123 |
2.26 |
17.07 |
43.665 |
5.212 |
T P |
| 1o57_A |
270 |
206 |
111 |
2.02 |
19.82 |
43.653 |
5.226 |
T P |
| 2p1z_B |
168 |
206 |
116 |
2.05 |
24.14 |
43.575 |
5.394 |
T P |
| 2igb_B |
173 |
206 |
117 |
2.02 |
23.08 |
43.419 |
5.512 |
T P |
| 2h07_B |
308 |
206 |
110 |
1.99 |
18.18 |
43.159 |
5.262 |
T P |
| 1a3c_A |
166 |
206 |
116 |
2.01 |
23.28 |
43.130 |
5.507 |
T P |
| 3dah_C |
300 |
206 |
110 |
2.18 |
18.18 |
43.060 |
4.831 |
T P |
| 1tc2_B |
196 |
206 |
118 |
2.29 |
14.41 |
42.706 |
4.931 |
T P |
| 1ufr_A |
167 |
206 |
117 |
2.06 |
28.21 |
42.705 |
5.425 |
T P |
| 2vfa_B |
205 |
206 |
115 |
2.17 |
16.52 |
42.491 |
5.064 |
T P |
| 1gph_1 |
465 |
206 |
112 |
1.87 |
25.89 |
42.445 |
5.691 |
T P |
| 1p18_B |
194 |
206 |
118 |
2.27 |
15.25 |
42.399 |
4.969 |
T P |
| 1tc1_B |
186 |
206 |
118 |
2.12 |
16.10 |
42.295 |
5.321 |
T P |
| 1i0i_B |
194 |
206 |
112 |
2.11 |
15.18 |
42.075 |
5.066 |
T P |
| 2geb_A |
184 |
206 |
114 |
2.19 |
15.79 |
41.956 |
4.977 |
T P |
| 2jbh_B |
213 |
206 |
118 |
2.25 |
22.03 |
41.945 |
5.011 |
T P |
| 1i13_B |
193 |
206 |
112 |
2.04 |
15.18 |
41.907 |
5.237 |
T P |
| 1i0l_B |
194 |
206 |
110 |
1.93 |
13.64 |
41.903 |
5.425 |
T P |
| 1i14_B |
194 |
206 |
112 |
2.09 |
15.18 |
41.689 |
5.125 |
T P |
| 2ps1_A |
224 |
206 |
112 |
2.04 |
16.07 |
41.593 |
5.240 |
T P |
| 1ecf_B |
500 |
206 |
111 |
2.03 |
21.62 |
41.510 |
5.208 |
T P |
| 1p4a_A |
269 |
206 |
113 |
2.06 |
18.58 |
41.281 |
5.232 |
T P |
| 2yzk_A |
177 |
206 |
113 |
2.02 |
23.01 |
40.902 |
5.324 |
T P |
| 1dbr_A |
227 |
206 |
111 |
2.27 |
18.92 |
40.769 |
4.679 |
T P |
| 1qk5_B |
217 |
206 |
111 |
2.15 |
18.92 |
40.617 |
4.926 |
T P |
| 1fsg_A |
233 |
206 |
109 |
2.11 |
18.35 |
40.535 |
4.934 |
T P |
| 1d6n_A |
214 |
206 |
109 |
2.17 |
20.18 |
40.392 |
4.808 |
T P |
| 1a98_A |
129 |
206 |
99 |
2.01 |
17.17 |
40.378 |
4.684 |
T P |
| 1cjb_C |
230 |
206 |
114 |
2.29 |
15.79 |
40.106 |
4.777 |
T P |
| 1ao0_A |
455 |
206 |
110 |
1.93 |
27.27 |
40.092 |
5.409 |
T P |
| 1sto_A |
208 |
206 |
110 |
2.12 |
24.55 |
40.089 |
4.961 |
T P |
| 1z7g_C |
204 |
206 |
113 |
2.26 |
16.81 |
40.012 |
4.783 |
T P |
| 1oro_A |
213 |
206 |
112 |
2.18 |
21.43 |
38.942 |
4.907 |
T P |
| 1a97_B |
148 |
206 |
106 |
2.12 |
19.81 |
38.666 |
4.781 |
T P |
| 1lh0_A |
213 |
206 |
109 |
2.19 |
20.18 |
38.281 |
4.768 |
T P |
| 1nul_A |
142 |
206 |
106 |
2.21 |
18.87 |
37.652 |
4.585 |
T P |
| 1umd_B |
323 |
206 |
72 |
2.27 |
13.89 |
24.894 |
3.036 |
T P |
| 1rz3_A |
184 |
206 |
66 |
2.62 |
13.64 |
21.855 |
2.428 |
T P |
NS : Total number of residues in Structure (rotated structure)
NT : Total number of residues in TARGET (frame of reference)
N : Total number of residues superimposed under 4.0 Angstrom distance cutoff
RMSD : RMS deviation calculated on all N residues superimposed under 4.0 Angstrom distance cutoff
Seq_Id : Sequence Identity. Percent of identical residues from the total of N aligned.
LGA_S : Structure similarity score calculated by internal LGA procedure (see LGA paper for details)
LGA_Q : Score (how tight is the superposition) calculated by the formula: Q = 0.1*N/(0.1+RMSD)
PLOTS : T - Flat text file (output from LGA program, rotated structure)
PLOTS : P - Plot of superimposed structures (3D plot colored as bars)
Citing LGA:
Zemla A., "LGA - a Method for Finding 3D Similarities in Protein Structures",
Nucleic Acids Research, 2003, Vol. 31, No. 13, pp. 3370-3374.
[MEDLINE]