LGA
Sequence Independent Analysis (LGA)
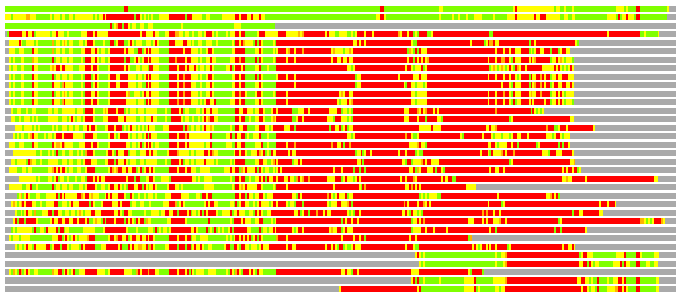
Frame of reference: Cat.Q2246_545_368.5wLII_11277_50
Total number of 3D structures: 34
LGA calculations using distance cutoff DIST: 4.0 A
Residues superimposed below 2.00 A: GREEN
Residues superimposed below 4.00 A: YELLOW
Residues superimposed below 6.00 A: ORANGE
Residues superimposed below 8.00 A: BROWN
Residues superimposed above 8.00 A or not aligned: RED
Terminal residues not aligned: GREY
Structure Deviation Summary
Calculations based on one final LGA superposition
(Bar representation of 3D plots, TEXT)

Structures ordered by LGA_S - score
| Structure |
NS |
NT |
N(dist=4.0) |
RMSD(N) |
Seq_ID(N) |
LGA_S |
LGA_Q |
PLOTS |
| 1jr3_D |
338 |
343 |
333 |
1.13 |
17.42 |
93.440 |
27.122 |
T P |
| 1xxh_A |
338 |
343 |
293 |
2.01 |
16.04 |
71.765 |
13.863 |
T P |
| 1jql_B |
140 |
343 |
133 |
1.36 |
12.03 |
36.713 |
9.116 |
T P |
| 1iqp_A |
326 |
343 |
141 |
2.54 |
7.09 |
27.294 |
5.336 |
T P |
| 2chq_A |
313 |
343 |
134 |
2.38 |
8.21 |
27.084 |
5.404 |
T P |
| 1in4_A |
298 |
343 |
143 |
2.50 |
11.89 |
27.083 |
5.499 |
T P |
| 1in6_A |
300 |
343 |
141 |
2.47 |
12.77 |
26.870 |
5.477 |
T P |
| 1hqc_A |
314 |
343 |
141 |
2.39 |
8.51 |
26.766 |
5.654 |
T P |
| 1in5_A |
301 |
343 |
138 |
2.41 |
10.87 |
26.235 |
5.493 |
T P |
| 1in8_A |
298 |
343 |
138 |
2.35 |
12.32 |
26.232 |
5.625 |
T P |
| 1j7k_A |
299 |
343 |
142 |
2.50 |
12.68 |
26.193 |
5.454 |
T P |
| 1in7_A |
298 |
343 |
139 |
2.40 |
12.23 |
26.164 |
5.560 |
T P |
| 1sxj_D |
328 |
343 |
144 |
2.51 |
6.25 |
26.047 |
5.513 |
T P |
| 1sxj_C |
322 |
343 |
136 |
2.40 |
7.35 |
25.843 |
5.437 |
T P |
| 1xxh_E |
334 |
343 |
138 |
2.45 |
6.52 |
25.608 |
5.412 |
T P |
| 1ixr_C |
308 |
343 |
136 |
2.38 |
10.29 |
25.591 |
5.482 |
T P |
| 1ixs_B |
315 |
343 |
135 |
2.46 |
11.11 |
25.480 |
5.274 |
T P |
| 1sxj_E |
317 |
343 |
142 |
2.59 |
5.63 |
25.452 |
5.278 |
T P |
| 1sxj_B |
316 |
343 |
140 |
2.51 |
5.00 |
24.693 |
5.373 |
T P |
| 1xxi_C |
366 |
343 |
131 |
2.50 |
6.11 |
24.590 |
5.042 |
T P |
| 1jr3_A |
366 |
343 |
127 |
2.58 |
7.87 |
24.344 |
4.738 |
T P |
| 2chg_A |
223 |
343 |
128 |
2.45 |
7.81 |
24.287 |
5.023 |
T P |
| 1a5t_A |
324 |
343 |
132 |
2.49 |
9.09 |
24.144 |
5.100 |
T P |
| 2qby_B |
368 |
343 |
129 |
2.57 |
3.88 |
24.112 |
4.830 |
T P |
| 2qby_A |
366 |
343 |
127 |
2.63 |
9.45 |
23.587 |
4.657 |
T P |
| 1fnn_A |
379 |
343 |
116 |
2.40 |
6.03 |
23.501 |
4.635 |
T P |
| 1sxj_A |
441 |
343 |
122 |
2.37 |
9.02 |
22.803 |
4.939 |
T P |
| 1njg_A |
240 |
343 |
113 |
2.39 |
7.96 |
22.211 |
4.545 |
T P |
| 2gno_A |
296 |
343 |
117 |
2.66 |
6.84 |
22.206 |
4.234 |
T P |
| 3bge_A |
163 |
343 |
82 |
1.80 |
8.54 |
21.978 |
4.311 |
T P |
| 3ctd_B |
158 |
343 |
78 |
1.80 |
5.13 |
20.767 |
4.113 |
T P |
| 2c9o_A |
398 |
343 |
108 |
2.52 |
7.41 |
20.572 |
4.123 |
T P |
| 2r9g_L |
188 |
343 |
80 |
2.04 |
7.50 |
17.679 |
3.735 |
T P |
| 2qw6_D |
86 |
343 |
76 |
1.97 |
7.89 |
17.418 |
3.678 |
T P |
NS : Total number of residues in Structure (rotated structure)
NT : Total number of residues in TARGET (frame of reference)
N : Total number of residues superimposed under 4.0 Angstrom distance cutoff
RMSD : RMS deviation calculated on all N residues superimposed under 4.0 Angstrom distance cutoff
Seq_Id : Sequence Identity. Percent of identical residues from the total of N aligned.
LGA_S : Structure similarity score calculated by internal LGA procedure (see LGA paper for details)
LGA_Q : Score (how tight is the superposition) calculated by the formula: Q = 0.1*N/(0.1+RMSD)
PLOTS : T - Flat text file (output from LGA program, rotated structure)
PLOTS : P - Plot of superimposed structures (3D plot colored as bars)
Citing LGA:
Zemla A., "LGA - a Method for Finding 3D Similarities in Protein Structures",
Nucleic Acids Research, 2003, Vol. 31, No. 13, pp. 3370-3374.
[MEDLINE]

