LGA
Sequence Independent Analysis (LGA)
Frame of reference: Cat.Q2246_545_379.5wLII_11277_71
Total number of 3D structures: 10
LGA calculations using distance cutoff DIST: 4.0 A
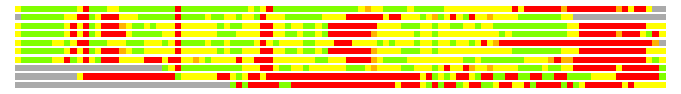
Residues superimposed below 2.00 A: GREEN
Residues superimposed below 4.00 A: YELLOW
Residues superimposed below 6.00 A: ORANGE
Residues superimposed below 8.00 A: BROWN
Residues superimposed above 8.00 A or not aligned: RED
Terminal residues not aligned: GREY
Structure Deviation Summary
Calculations based on one final LGA superposition
(Bar representation of 3D plots, TEXT)
Structures ordered by LGA_S - score
| Structure |
NS |
NT |
N(dist=4.0) |
RMSD(N) |
Seq_ID(N) |
LGA_S |
LGA_Q |
PLOTS |
| 1q06_B |
126 |
106 |
83 |
2.04 |
12.05 |
69.584 |
3.883 |
T P |
| 1r8d_A |
109 |
106 |
73 |
2.22 |
8.22 |
53.989 |
3.143 |
T P |
| 3d71_A |
277 |
106 |
79 |
2.20 |
6.33 |
51.802 |
3.434 |
T P |
| 1r8e_A |
275 |
106 |
80 |
2.32 |
6.25 |
51.509 |
3.311 |
T P |
| 2zhg_A |
121 |
106 |
72 |
2.35 |
11.11 |
50.714 |
2.933 |
T P |
| 3d70_A |
276 |
106 |
80 |
2.42 |
6.25 |
49.967 |
3.176 |
T P |
| 3d6z_A |
277 |
106 |
75 |
2.63 |
4.00 |
48.778 |
2.747 |
T P |
| 1q08_A |
94 |
106 |
64 |
2.47 |
7.81 |
42.489 |
2.491 |
T P |
| 3ciw_A |
346 |
106 |
34 |
2.31 |
5.88 |
23.425 |
1.411 |
T P |
| 3cix_A |
346 |
106 |
25 |
2.42 |
0.00 |
16.981 |
0.992 |
T P |
NS : Total number of residues in Structure (rotated structure)
NT : Total number of residues in TARGET (frame of reference)
N : Total number of residues superimposed under 4.0 Angstrom distance cutoff
RMSD : RMS deviation calculated on all N residues superimposed under 4.0 Angstrom distance cutoff
Seq_Id : Sequence Identity. Percent of identical residues from the total of N aligned.
LGA_S : Structure similarity score calculated by internal LGA procedure (see LGA paper for details)
LGA_Q : Score (how tight is the superposition) calculated by the formula: Q = 0.1*N/(0.1+RMSD)
PLOTS : T - Flat text file (output from LGA program, rotated structure)
PLOTS : P - Plot of superimposed structures (3D plot colored as bars)
Citing LGA:
Zemla A., "LGA - a Method for Finding 3D Similarities in Protein Structures",
Nucleic Acids Research, 2003, Vol. 31, No. 13, pp. 3370-3374.
[MEDLINE]