LGA
Sequence Independent Analysis (LGA)
Frame of reference: Cat.Q2246_545_399.5wLII_11277_134
Total number of 3D structures: 65
LGA calculations using distance cutoff DIST: 4.0 A
Residues superimposed below 2.00 A: GREEN
Residues superimposed below 4.00 A: YELLOW
Residues superimposed below 6.00 A: ORANGE
Residues superimposed below 8.00 A: BROWN
Residues superimposed above 8.00 A or not aligned: RED
Terminal residues not aligned: GREY
Structure Deviation Summary
Calculations based on one final LGA superposition
(Bar representation of 3D plots, TEXT)
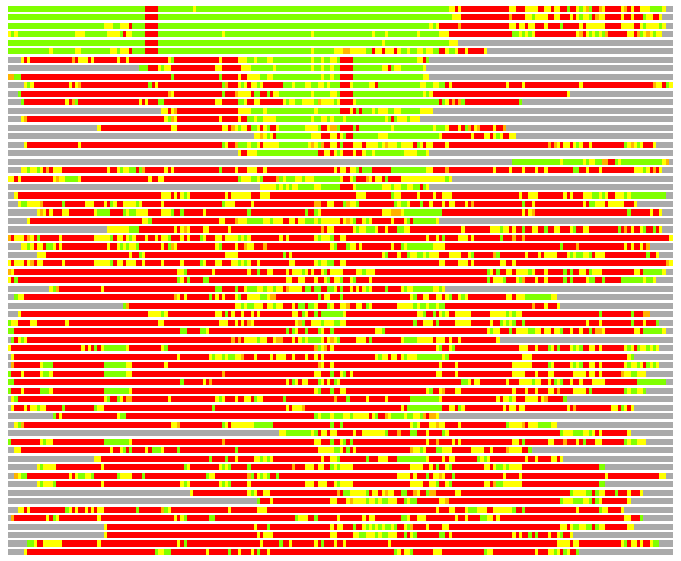
Structures ordered by LGA_S - score
| Structure |
NS |
NT |
N(dist=4.0) |
RMSD(N) |
Seq_ID(N) |
LGA_S |
LGA_Q |
PLOTS |
| 1cuk_A |
190 |
208 |
166 |
1.45 |
28.31 |
78.028 |
10.724 |
T P |
| 1hjp_A |
186 |
208 |
163 |
1.37 |
26.99 |
76.533 |
11.075 |
T P |
| 2h5x_A |
183 |
208 |
158 |
1.53 |
28.48 |
73.262 |
9.713 |
T P |
| 1bvs_A |
183 |
208 |
159 |
1.72 |
23.90 |
69.541 |
8.756 |
T P |
| 1d8l_A |
140 |
208 |
137 |
0.85 |
31.39 |
64.564 |
14.460 |
T P |
| 1ixr_B |
191 |
208 |
133 |
1.70 |
30.83 |
58.843 |
7.408 |
T P |
| 2bgw_A |
219 |
208 |
67 |
2.00 |
22.39 |
27.616 |
3.191 |
T P |
| 2a1j_B |
79 |
208 |
62 |
1.78 |
14.52 |
26.561 |
3.300 |
T P |
| 2bhn_A |
211 |
208 |
60 |
1.86 |
26.67 |
26.539 |
3.066 |
T P |
| 1dgt_B |
660 |
208 |
73 |
2.36 |
19.18 |
26.502 |
2.967 |
T P |
| 1x2i_A |
68 |
208 |
59 |
1.92 |
23.73 |
25.812 |
2.918 |
T P |
| 2owo_A |
586 |
208 |
66 |
2.23 |
16.67 |
25.551 |
2.837 |
T P |
| 1z00_A |
84 |
208 |
60 |
2.03 |
18.33 |
25.126 |
2.816 |
T P |
| 2csd_A |
516 |
208 |
61 |
2.06 |
22.95 |
24.781 |
2.826 |
T P |
| 2w9m_B |
559 |
208 |
69 |
2.26 |
28.99 |
24.587 |
2.921 |
T P |
| 2i1q_A |
311 |
208 |
60 |
2.05 |
23.33 |
24.493 |
2.796 |
T P |
| 1v9p_A |
584 |
208 |
73 |
2.71 |
17.81 |
23.034 |
2.597 |
T P |
| 2duy_A |
65 |
208 |
50 |
1.87 |
30.00 |
21.922 |
2.538 |
T P |
| 1ixs_A |
50 |
208 |
47 |
1.63 |
14.89 |
21.552 |
2.719 |
T P |
| 2zj8_A |
700 |
208 |
67 |
2.61 |
8.96 |
21.521 |
2.474 |
T P |
| 3c1y_A |
349 |
208 |
67 |
2.49 |
8.96 |
21.089 |
2.590 |
T P |
| 1kft_A |
56 |
208 |
48 |
2.17 |
18.75 |
19.220 |
2.117 |
T P |
| 1wpw_A |
336 |
208 |
59 |
2.61 |
8.47 |
18.977 |
2.175 |
T P |
| 2va8_B |
695 |
208 |
62 |
2.94 |
8.06 |
18.810 |
2.037 |
T P |
| 2csb_A |
517 |
208 |
54 |
2.42 |
3.70 |
18.252 |
2.144 |
T P |
| 2nrt_A |
217 |
208 |
54 |
2.56 |
9.26 |
18.090 |
2.026 |
T P |
| 2dpj_A |
373 |
208 |
58 |
2.75 |
3.45 |
18.061 |
2.037 |
T P |
| 2alz_A |
373 |
208 |
59 |
2.92 |
3.39 |
18.044 |
1.954 |
T P |
| 2p6r_A |
683 |
208 |
56 |
2.72 |
3.57 |
17.936 |
1.983 |
T P |
| 1ord_A |
730 |
208 |
52 |
2.81 |
11.54 |
17.442 |
1.787 |
T P |
| 1t3n_A |
388 |
208 |
55 |
3.01 |
9.09 |
17.114 |
1.770 |
T P |
| 3c5f_A |
326 |
208 |
58 |
2.68 |
8.62 |
16.911 |
2.084 |
T P |
| 1kej_A |
357 |
208 |
47 |
2.44 |
10.64 |
16.774 |
1.851 |
T P |
| 1dk2_A |
86 |
208 |
52 |
2.39 |
5.77 |
16.447 |
2.088 |
T P |
| 3c65_A |
152 |
208 |
50 |
2.57 |
14.00 |
16.232 |
1.875 |
T P |
| 1nzp_A |
86 |
208 |
49 |
2.53 |
8.16 |
16.103 |
1.865 |
T P |
| 2fmp_A |
326 |
208 |
53 |
2.86 |
9.43 |
16.076 |
1.793 |
T P |
| 1huo_A |
325 |
208 |
51 |
2.73 |
7.84 |
16.000 |
1.803 |
T P |
| 2ihm_B |
336 |
208 |
50 |
2.42 |
6.00 |
15.974 |
1.988 |
T P |
| 1bno_A |
87 |
208 |
49 |
2.74 |
10.20 |
15.786 |
1.727 |
T P |
| 1rzt_A |
327 |
208 |
48 |
2.58 |
2.08 |
15.744 |
1.791 |
T P |
| 2gbd_A |
230 |
208 |
48 |
2.67 |
10.42 |
15.511 |
1.733 |
T P |
| 1cf6_A |
325 |
208 |
45 |
2.52 |
8.89 |
15.105 |
1.717 |
T P |
| 2pfn_A |
325 |
208 |
47 |
2.75 |
4.26 |
15.095 |
1.648 |
T P |
| 1jms_A |
360 |
208 |
47 |
2.56 |
10.64 |
15.091 |
1.764 |
T P |
| 3c5g_B |
329 |
208 |
44 |
2.39 |
2.27 |
14.738 |
1.764 |
T P |
| 2z43_B |
290 |
208 |
45 |
2.60 |
8.89 |
14.726 |
1.669 |
T P |
| 2f1j_A |
299 |
208 |
45 |
2.63 |
15.56 |
14.660 |
1.651 |
T P |
| 2edu_A |
98 |
208 |
40 |
2.44 |
20.00 |
14.539 |
1.577 |
T P |
| 2nrr_A |
139 |
208 |
47 |
2.70 |
10.64 |
14.477 |
1.679 |
T P |
| 1rpl_A |
241 |
208 |
44 |
2.47 |
11.36 |
14.464 |
1.709 |
T P |
| 2bcq_A |
324 |
208 |
42 |
2.56 |
4.76 |
14.366 |
1.581 |
T P |
| 1pzn_A |
300 |
208 |
44 |
2.70 |
11.36 |
14.146 |
1.572 |
T P |
| 2bke_A |
293 |
208 |
41 |
2.50 |
2.44 |
14.056 |
1.576 |
T P |
| 1vdd_A |
199 |
208 |
48 |
2.83 |
8.33 |
13.826 |
1.639 |
T P |
| 3e1s_A |
517 |
208 |
43 |
2.77 |
13.95 |
13.741 |
1.501 |
T P |
| 2v1c_A |
198 |
208 |
49 |
2.82 |
8.16 |
13.725 |
1.678 |
T P |
| 1jaj_A |
174 |
208 |
43 |
2.84 |
4.65 |
13.456 |
1.462 |
T P |
| 1jn3_A |
242 |
208 |
40 |
2.63 |
5.00 |
13.033 |
1.467 |
T P |
| 1a6d_A |
503 |
208 |
41 |
2.73 |
9.76 |
12.996 |
1.448 |
T P |
| 1zq1_C |
508 |
208 |
35 |
2.75 |
17.14 |
12.362 |
1.226 |
T P |
| 1bpb_A |
242 |
208 |
38 |
2.60 |
5.26 |
12.341 |
1.406 |
T P |
| 2van_A |
240 |
208 |
35 |
2.59 |
14.29 |
11.645 |
1.299 |
T P |
| 1taq_A |
807 |
208 |
34 |
2.86 |
2.94 |
10.973 |
1.149 |
T P |
| 1bgx_T |
828 |
208 |
31 |
2.60 |
6.45 |
10.777 |
1.149 |
T P |
NS : Total number of residues in Structure (rotated structure)
NT : Total number of residues in TARGET (frame of reference)
N : Total number of residues superimposed under 4.0 Angstrom distance cutoff
RMSD : RMS deviation calculated on all N residues superimposed under 4.0 Angstrom distance cutoff
Seq_Id : Sequence Identity. Percent of identical residues from the total of N aligned.
LGA_S : Structure similarity score calculated by internal LGA procedure (see LGA paper for details)
LGA_Q : Score (how tight is the superposition) calculated by the formula: Q = 0.1*N/(0.1+RMSD)
PLOTS : T - Flat text file (output from LGA program, rotated structure)
PLOTS : P - Plot of superimposed structures (3D plot colored as bars)
Citing LGA:
Zemla A., "LGA - a Method for Finding 3D Similarities in Protein Structures",
Nucleic Acids Research, 2003, Vol. 31, No. 13, pp. 3370-3374.
[MEDLINE]