LGA
Sequence Independent Analysis (LGA)
Frame of reference: Cat.Q2246_545_404.5wLII_11277_144
Total number of 3D structures: 32
LGA calculations using distance cutoff DIST: 4.0 A
Residues superimposed below 2.00 A: GREEN
Residues superimposed below 4.00 A: YELLOW
Residues superimposed below 6.00 A: ORANGE
Residues superimposed below 8.00 A: BROWN
Residues superimposed above 8.00 A or not aligned: RED
Terminal residues not aligned: GREY
Structure Deviation Summary
Calculations based on one final LGA superposition
(Bar representation of 3D plots, TEXT)
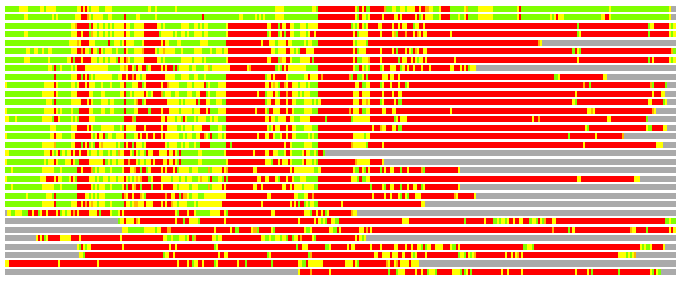
Structures ordered by LGA_S - score
| Structure |
NS |
NT |
N(dist=4.0) |
RMSD(N) |
Seq_ID(N) |
LGA_S |
LGA_Q |
PLOTS |
| 2der_B |
359 |
327 |
287 |
1.57 |
20.91 |
82.402 |
17.192 |
T P |
| 2hma_A |
364 |
327 |
272 |
1.66 |
17.65 |
77.559 |
15.480 |
T P |
| 2nz2_A |
402 |
327 |
138 |
2.27 |
18.84 |
28.556 |
5.832 |
T P |
| 1vl2_A |
398 |
327 |
135 |
2.25 |
19.26 |
28.411 |
5.742 |
T P |
| 2c5s_A |
372 |
327 |
126 |
2.09 |
27.78 |
27.960 |
5.748 |
T P |
| 1k92_A |
444 |
327 |
134 |
2.42 |
16.42 |
27.725 |
5.326 |
T P |
| 1kor_B |
386 |
327 |
134 |
2.34 |
20.15 |
27.055 |
5.491 |
T P |
| 2vxo_B |
658 |
327 |
137 |
2.46 |
20.44 |
26.858 |
5.346 |
T P |
| 1wy5_A |
311 |
327 |
126 |
2.21 |
15.87 |
26.696 |
5.453 |
T P |
| 1kqp_A |
271 |
327 |
128 |
2.33 |
14.84 |
26.494 |
5.269 |
T P |
| 1xng_B |
262 |
327 |
128 |
2.33 |
19.53 |
26.451 |
5.276 |
T P |
| 2e18_A |
256 |
327 |
124 |
2.31 |
13.71 |
26.005 |
5.136 |
T P |
| 3dpi_A |
269 |
327 |
123 |
2.32 |
19.51 |
25.712 |
5.084 |
T P |
| 1ct9_A |
497 |
327 |
122 |
2.38 |
17.21 |
25.122 |
4.927 |
T P |
| 3fiu_A |
238 |
327 |
118 |
2.31 |
20.34 |
24.564 |
4.896 |
T P |
| 3dla_C |
657 |
327 |
116 |
2.39 |
13.79 |
24.341 |
4.662 |
T P |
| 1ni5_A |
433 |
327 |
112 |
2.23 |
20.54 |
24.195 |
4.808 |
T P |
| 2pg3_A |
221 |
327 |
112 |
2.19 |
15.18 |
24.146 |
4.882 |
T P |
| 3bl5_E |
199 |
327 |
117 |
2.25 |
14.53 |
23.843 |
4.980 |
T P |
| 2ywc_A |
475 |
327 |
116 |
2.48 |
25.00 |
23.529 |
4.505 |
T P |
| 2pzb_A |
250 |
327 |
120 |
2.45 |
17.50 |
23.507 |
4.715 |
T P |
| 2ywb_A |
471 |
327 |
112 |
2.38 |
24.11 |
23.084 |
4.509 |
T P |
| 1gpm_A |
501 |
327 |
106 |
2.42 |
17.92 |
22.534 |
4.199 |
T P |
| 2dpl_A |
287 |
327 |
106 |
2.50 |
23.58 |
21.612 |
4.074 |
T P |
| 2z1m_A |
338 |
327 |
64 |
2.69 |
7.81 |
13.064 |
2.295 |
T P |
| 1eee_A |
582 |
327 |
57 |
2.66 |
1.75 |
11.654 |
2.062 |
T P |
| 1t3t_A |
1283 |
327 |
53 |
2.79 |
7.55 |
11.308 |
1.832 |
T P |
| 2vfd_A |
247 |
327 |
54 |
2.52 |
5.56 |
11.126 |
2.060 |
T P |
| 2po3_A |
393 |
327 |
53 |
2.67 |
9.43 |
11.104 |
1.912 |
T P |
| 1dfo_B |
417 |
327 |
50 |
2.94 |
2.00 |
9.437 |
1.647 |
T P |
| 2h9a_B |
307 |
327 |
44 |
2.89 |
6.82 |
8.706 |
1.474 |
T P |
| 1wrv_B |
305 |
327 |
34 |
2.68 |
11.76 |
7.467 |
1.221 |
T P |
NS : Total number of residues in Structure (rotated structure)
NT : Total number of residues in TARGET (frame of reference)
N : Total number of residues superimposed under 4.0 Angstrom distance cutoff
RMSD : RMS deviation calculated on all N residues superimposed under 4.0 Angstrom distance cutoff
Seq_Id : Sequence Identity. Percent of identical residues from the total of N aligned.
LGA_S : Structure similarity score calculated by internal LGA procedure (see LGA paper for details)
LGA_Q : Score (how tight is the superposition) calculated by the formula: Q = 0.1*N/(0.1+RMSD)
PLOTS : T - Flat text file (output from LGA program, rotated structure)
PLOTS : P - Plot of superimposed structures (3D plot colored as bars)
Citing LGA:
Zemla A., "LGA - a Method for Finding 3D Similarities in Protein Structures",
Nucleic Acids Research, 2003, Vol. 31, No. 13, pp. 3370-3374.
[MEDLINE]