LGA
Sequence Independent Analysis (LGA)
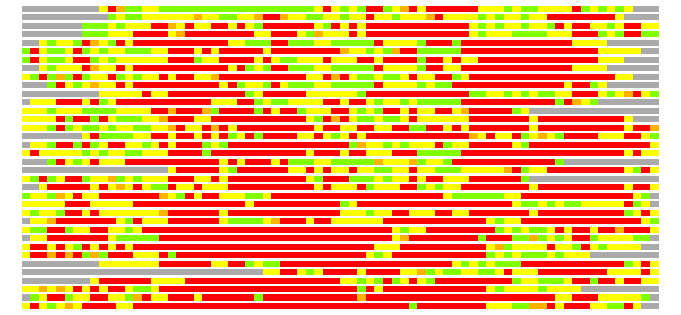
Frame of reference: Cat.Q2246_545_410.5wLII_11277_153
Total number of 3D structures: 36
LGA calculations using distance cutoff DIST: 4.0 A
Residues superimposed below 2.00 A: GREEN
Residues superimposed below 4.00 A: YELLOW
Residues superimposed below 6.00 A: ORANGE
Residues superimposed below 8.00 A: BROWN
Residues superimposed above 8.00 A or not aligned: RED
Terminal residues not aligned: GREY
Structure Deviation Summary
Calculations based on one final LGA superposition
(Bar representation of 3D plots, TEXT)

Structures ordered by LGA_S - score
| Structure |
NS |
NT |
N(dist=4.0) |
RMSD(N) |
Seq_ID(N) |
LGA_S |
LGA_Q |
PLOTS |
| 2bum_A |
202 |
74 |
50 |
2.25 |
18.00 |
53.666 |
2.129 |
T P |
| 2bux_A |
202 |
74 |
48 |
2.73 |
25.00 |
47.822 |
1.694 |
T P |
| 2pu6_A |
283 |
74 |
36 |
2.70 |
13.89 |
32.388 |
1.287 |
T P |
| 2og1_A |
285 |
74 |
34 |
2.58 |
14.71 |
32.092 |
1.267 |
T P |
| 2e3j_A |
346 |
74 |
34 |
2.33 |
17.65 |
31.984 |
1.400 |
T P |
| 1a8s_A |
273 |
74 |
35 |
2.66 |
2.86 |
31.733 |
1.267 |
T P |
| 1zoi_A |
275 |
74 |
35 |
2.75 |
2.86 |
31.553 |
1.230 |
T P |
| 2zjf_A |
346 |
74 |
34 |
2.45 |
17.65 |
31.525 |
1.332 |
T P |
| 1a8u_A |
277 |
74 |
33 |
2.67 |
3.03 |
31.203 |
1.191 |
T P |
| 3cxu_A |
320 |
74 |
35 |
2.57 |
2.86 |
31.103 |
1.310 |
T P |
| 1cqz_B |
541 |
74 |
34 |
2.58 |
0.00 |
30.168 |
1.269 |
T P |
| 2psf_A |
307 |
74 |
33 |
2.60 |
3.03 |
30.119 |
1.224 |
T P |
| 1brt_A |
277 |
74 |
35 |
2.76 |
2.86 |
29.837 |
1.225 |
T P |
| 1bro_A |
277 |
74 |
33 |
2.67 |
3.03 |
29.114 |
1.190 |
T P |
| 1zd3_A |
547 |
74 |
33 |
2.82 |
12.12 |
28.839 |
1.130 |
T P |
| 2vf2_A |
284 |
74 |
33 |
2.76 |
3.03 |
28.599 |
1.155 |
T P |
| 3fob_A |
277 |
74 |
30 |
2.69 |
3.33 |
28.453 |
1.076 |
T P |
| 1a88_A |
275 |
74 |
30 |
2.57 |
6.67 |
28.309 |
1.125 |
T P |
| 2cjp_A |
320 |
74 |
30 |
2.41 |
6.67 |
28.203 |
1.193 |
T P |
| 1y37_A |
294 |
74 |
31 |
2.68 |
6.45 |
28.155 |
1.116 |
T P |
| 1hkh_A |
279 |
74 |
31 |
2.69 |
3.23 |
27.228 |
1.109 |
T P |
| 1c4x_A |
281 |
74 |
29 |
2.69 |
10.34 |
27.169 |
1.040 |
T P |
| 2rhw_A |
283 |
74 |
29 |
2.55 |
6.90 |
25.496 |
1.095 |
T P |
| 1ehy_A |
282 |
74 |
28 |
2.66 |
3.57 |
25.296 |
1.013 |
T P |
| 2psd_A |
305 |
74 |
30 |
2.86 |
0.00 |
25.172 |
1.014 |
T P |
| 2puj_A |
283 |
74 |
28 |
2.76 |
10.71 |
24.816 |
0.978 |
T P |
| 1iup_A |
271 |
74 |
25 |
2.68 |
4.00 |
23.385 |
0.899 |
T P |
| 1bn6_A |
291 |
74 |
25 |
2.57 |
0.00 |
23.372 |
0.937 |
T P |
| 1m33_A |
256 |
74 |
26 |
2.69 |
3.85 |
23.218 |
0.933 |
T P |
| 1cqw_A |
295 |
74 |
25 |
2.77 |
8.00 |
23.163 |
0.870 |
T P |
| 2psj_A |
306 |
74 |
24 |
2.63 |
0.00 |
22.521 |
0.879 |
T P |
| 2v9z_A |
302 |
74 |
26 |
2.81 |
3.85 |
22.340 |
0.893 |
T P |
| 1va4_A |
271 |
74 |
25 |
2.52 |
12.00 |
22.340 |
0.956 |
T P |
| 1u2e_A |
286 |
74 |
25 |
2.82 |
16.00 |
21.265 |
0.857 |
T P |
| 2d0d_A |
271 |
74 |
22 |
2.79 |
4.55 |
20.789 |
0.760 |
T P |
| 1wom_A |
271 |
74 |
22 |
2.71 |
0.00 |
20.485 |
0.782 |
T P |
NS : Total number of residues in Structure (rotated structure)
NT : Total number of residues in TARGET (frame of reference)
N : Total number of residues superimposed under 4.0 Angstrom distance cutoff
RMSD : RMS deviation calculated on all N residues superimposed under 4.0 Angstrom distance cutoff
Seq_Id : Sequence Identity. Percent of identical residues from the total of N aligned.
LGA_S : Structure similarity score calculated by internal LGA procedure (see LGA paper for details)
LGA_Q : Score (how tight is the superposition) calculated by the formula: Q = 0.1*N/(0.1+RMSD)
PLOTS : T - Flat text file (output from LGA program, rotated structure)
PLOTS : P - Plot of superimposed structures (3D plot colored as bars)
Citing LGA:
Zemla A., "LGA - a Method for Finding 3D Similarities in Protein Structures",
Nucleic Acids Research, 2003, Vol. 31, No. 13, pp. 3370-3374.
[MEDLINE]

