LGA
Sequence Independent Analysis (LGA)
Frame of reference: Cat.Q2246_545_431.5wLII_11277_241
Total number of 3D structures: 33
LGA calculations using distance cutoff DIST: 4.0 A
Residues superimposed below 2.00 A: GREEN
Residues superimposed below 4.00 A: YELLOW
Residues superimposed below 6.00 A: ORANGE
Residues superimposed below 8.00 A: BROWN
Residues superimposed above 8.00 A or not aligned: RED
Terminal residues not aligned: GREY
Structure Deviation Summary
Calculations based on one final LGA superposition
(Bar representation of 3D plots, TEXT)
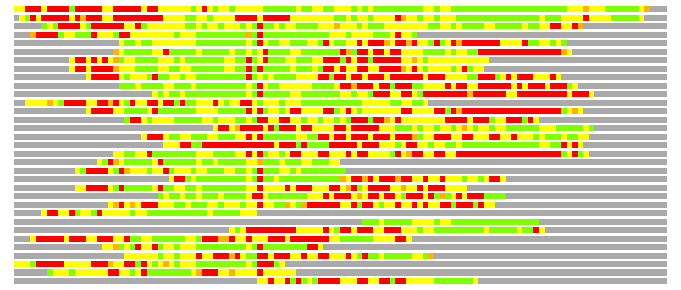
Structures ordered by LGA_S - score
| Structure |
NS |
NT |
N(dist=4.0) |
RMSD(N) |
Seq_ID(N) |
LGA_S |
LGA_Q |
PLOTS |
| 1ei3_C |
397 |
118 |
95 |
2.23 |
13.68 |
64.330 |
4.085 |
T P |
| 1m1j_C |
390 |
118 |
83 |
2.41 |
18.07 |
51.898 |
3.310 |
T P |
| 1g8x_A |
1009 |
118 |
83 |
2.31 |
4.82 |
48.920 |
3.439 |
T P |
| 1y1u_A |
544 |
118 |
61 |
2.26 |
1.64 |
38.452 |
2.580 |
T P |
| 2dw4_A |
634 |
118 |
62 |
2.27 |
12.90 |
38.408 |
2.619 |
T P |
| 2iw5_A |
666 |
118 |
59 |
2.23 |
13.56 |
38.404 |
2.532 |
T P |
| 2hn2_A |
331 |
118 |
59 |
2.33 |
5.08 |
36.784 |
2.427 |
T P |
| 2iub_F |
342 |
118 |
56 |
2.32 |
3.57 |
36.292 |
2.311 |
T P |
| 1jch_A |
468 |
118 |
53 |
2.49 |
7.55 |
36.195 |
2.050 |
T P |
| 2z3y_A |
643 |
118 |
56 |
2.30 |
12.50 |
36.092 |
2.333 |
T P |
| 2v1d_A |
666 |
118 |
48 |
2.04 |
18.75 |
35.277 |
2.244 |
T P |
| 1f5n_A |
570 |
118 |
57 |
2.50 |
8.77 |
32.891 |
2.196 |
T P |
| 2hko_A |
647 |
118 |
55 |
2.43 |
7.27 |
32.148 |
2.170 |
T P |
| 2b5u_A |
470 |
118 |
52 |
2.59 |
7.69 |
31.560 |
1.934 |
T P |
| 1zvu_A |
685 |
118 |
50 |
2.39 |
6.00 |
31.508 |
2.012 |
T P |
| 1bg1_A |
559 |
118 |
55 |
2.48 |
12.73 |
31.312 |
2.129 |
T P |
| 1qvr_A |
803 |
118 |
45 |
2.21 |
4.44 |
30.608 |
1.951 |
T P |
| 2h94_A |
647 |
118 |
51 |
2.38 |
7.84 |
30.433 |
2.060 |
T P |
| 1h6k_C |
733 |
118 |
42 |
2.05 |
2.38 |
30.363 |
1.954 |
T P |
| 1ij5_A |
305 |
118 |
42 |
2.07 |
2.38 |
30.332 |
1.935 |
T P |
| 2r0q_C |
193 |
118 |
46 |
2.38 |
6.52 |
29.503 |
1.858 |
T P |
| 2dq3_A |
425 |
118 |
49 |
2.57 |
12.24 |
29.337 |
1.832 |
T P |
| 2dq0_A |
447 |
118 |
45 |
2.21 |
8.89 |
29.221 |
1.946 |
T P |
| 1wle_B |
469 |
118 |
47 |
2.58 |
4.26 |
27.592 |
1.757 |
T P |
| 1smq_A |
329 |
118 |
35 |
2.14 |
5.71 |
25.085 |
1.566 |
T P |
| 2j5u_A |
210 |
118 |
32 |
1.64 |
9.38 |
25.071 |
1.835 |
T P |
| 1lrz_A |
400 |
118 |
38 |
2.36 |
5.26 |
24.632 |
1.548 |
T P |
| 1ses_A |
421 |
118 |
40 |
2.55 |
12.50 |
24.319 |
1.507 |
T P |
| 1jk0_A |
334 |
118 |
35 |
2.05 |
8.57 |
24.318 |
1.630 |
T P |
| 2k27_A |
159 |
118 |
41 |
2.64 |
7.32 |
22.995 |
1.498 |
T P |
| 2fge_A |
979 |
118 |
35 |
2.51 |
0.00 |
21.792 |
1.340 |
T P |
| 3bu8_B |
207 |
118 |
38 |
2.68 |
10.53 |
20.941 |
1.368 |
T P |
| 1k78_A |
124 |
118 |
27 |
2.61 |
7.41 |
15.894 |
0.997 |
T P |
NS : Total number of residues in Structure (rotated structure)
NT : Total number of residues in TARGET (frame of reference)
N : Total number of residues superimposed under 4.0 Angstrom distance cutoff
RMSD : RMS deviation calculated on all N residues superimposed under 4.0 Angstrom distance cutoff
Seq_Id : Sequence Identity. Percent of identical residues from the total of N aligned.
LGA_S : Structure similarity score calculated by internal LGA procedure (see LGA paper for details)
LGA_Q : Score (how tight is the superposition) calculated by the formula: Q = 0.1*N/(0.1+RMSD)
PLOTS : T - Flat text file (output from LGA program, rotated structure)
PLOTS : P - Plot of superimposed structures (3D plot colored as bars)
Citing LGA:
Zemla A., "LGA - a Method for Finding 3D Similarities in Protein Structures",
Nucleic Acids Research, 2003, Vol. 31, No. 13, pp. 3370-3374.
[MEDLINE]