LGA
Sequence Independent Analysis (LGA)
Frame of reference: Cat.Q2246_545_444.5wLII_11277_290
Total number of 3D structures: 31
LGA calculations using distance cutoff DIST: 4.0 A
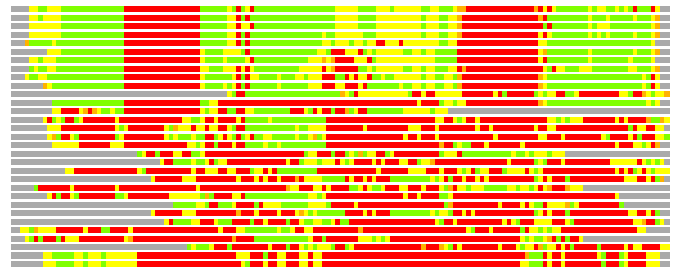
Residues superimposed below 2.00 A: GREEN
Residues superimposed below 4.00 A: YELLOW
Residues superimposed below 6.00 A: ORANGE
Residues superimposed below 8.00 A: BROWN
Residues superimposed above 8.00 A or not aligned: RED
Terminal residues not aligned: GREY
Structure Deviation Summary
Calculations based on one final LGA superposition
(Bar representation of 3D plots, TEXT)

Structures ordered by LGA_S - score
| Structure |
NS |
NT |
N(dist=4.0) |
RMSD(N) |
Seq_ID(N) |
LGA_S |
LGA_Q |
PLOTS |
| 1ade_A |
431 |
146 |
102 |
1.97 |
15.69 |
58.247 |
4.922 |
T P |
| 1cg1_A |
431 |
146 |
103 |
1.99 |
16.50 |
58.159 |
4.923 |
T P |
| 1kjx_A |
431 |
146 |
102 |
1.98 |
16.67 |
57.769 |
4.900 |
T P |
| 1cg3_A |
431 |
146 |
103 |
2.03 |
16.50 |
57.630 |
4.845 |
T P |
| 1cg4_A |
431 |
146 |
100 |
1.96 |
18.00 |
56.285 |
4.854 |
T P |
| 2v40_A |
419 |
146 |
96 |
1.93 |
14.58 |
53.663 |
4.734 |
T P |
| 1iwe_B |
431 |
146 |
97 |
2.07 |
14.43 |
53.463 |
4.475 |
T P |
| 1p9b_A |
424 |
146 |
96 |
2.11 |
11.46 |
52.799 |
4.354 |
T P |
| 1dj2_A |
429 |
146 |
98 |
1.99 |
10.20 |
49.609 |
4.699 |
T P |
| 1dj3_A |
432 |
146 |
93 |
1.88 |
8.60 |
48.235 |
4.706 |
T P |
| 1gax_A |
862 |
146 |
64 |
2.43 |
7.81 |
31.220 |
2.533 |
T P |
| 2d7u_A |
321 |
146 |
54 |
1.60 |
14.81 |
30.319 |
3.177 |
T P |
| 2g36_A |
322 |
146 |
52 |
2.19 |
3.85 |
28.404 |
2.275 |
T P |
| 2ct8_A |
465 |
146 |
53 |
2.37 |
3.77 |
25.913 |
2.144 |
T P |
| 1h3n_A |
814 |
146 |
51 |
2.62 |
9.80 |
24.993 |
1.874 |
T P |
| 1a8h_A |
500 |
146 |
52 |
2.38 |
7.69 |
24.335 |
2.097 |
T P |
| 3fnr_A |
449 |
146 |
46 |
2.53 |
8.70 |
23.276 |
1.749 |
T P |
| 1wkb_A |
791 |
146 |
48 |
2.28 |
10.42 |
22.934 |
2.019 |
T P |
| 2v0c_A |
810 |
146 |
48 |
2.54 |
6.25 |
22.865 |
1.820 |
T P |
| 1ile_A |
821 |
146 |
52 |
2.74 |
7.69 |
22.639 |
1.829 |
T P |
| 2d5b_A |
500 |
146 |
47 |
2.66 |
4.26 |
22.054 |
1.706 |
T P |
| 1wz2_A |
948 |
146 |
47 |
2.67 |
8.51 |
22.027 |
1.695 |
T P |
| 1rqg_A |
606 |
146 |
43 |
2.16 |
6.98 |
22.025 |
1.905 |
T P |
| 1u0b_B |
461 |
146 |
44 |
2.40 |
11.36 |
21.936 |
1.758 |
T P |
| 2d54_A |
500 |
146 |
44 |
2.51 |
4.55 |
21.346 |
1.683 |
T P |
| 3c8z_B |
401 |
146 |
41 |
2.48 |
4.88 |
20.671 |
1.589 |
T P |
| 2cyb_A |
319 |
146 |
42 |
2.64 |
7.14 |
20.379 |
1.530 |
T P |
| 1ffy_A |
917 |
146 |
41 |
2.35 |
0.00 |
20.136 |
1.672 |
T P |
| 1f4l_A |
545 |
146 |
41 |
2.60 |
4.88 |
20.007 |
1.519 |
T P |
| 1qqt_A |
546 |
146 |
44 |
2.70 |
2.27 |
19.783 |
1.571 |
T P |
| 1pfv_A |
547 |
146 |
43 |
2.60 |
2.33 |
19.698 |
1.595 |
T P |
NS : Total number of residues in Structure (rotated structure)
NT : Total number of residues in TARGET (frame of reference)
N : Total number of residues superimposed under 4.0 Angstrom distance cutoff
RMSD : RMS deviation calculated on all N residues superimposed under 4.0 Angstrom distance cutoff
Seq_Id : Sequence Identity. Percent of identical residues from the total of N aligned.
LGA_S : Structure similarity score calculated by internal LGA procedure (see LGA paper for details)
LGA_Q : Score (how tight is the superposition) calculated by the formula: Q = 0.1*N/(0.1+RMSD)
PLOTS : T - Flat text file (output from LGA program, rotated structure)
PLOTS : P - Plot of superimposed structures (3D plot colored as bars)
Citing LGA:
Zemla A., "LGA - a Method for Finding 3D Similarities in Protein Structures",
Nucleic Acids Research, 2003, Vol. 31, No. 13, pp. 3370-3374.
[MEDLINE]

