LGA
Sequence Independent Analysis (LGA)
Frame of reference: Cat.Q2246_545_449.5wLII_11278_14
Total number of 3D structures: 23
LGA calculations using distance cutoff DIST: 4.0 A
Residues superimposed below 2.00 A: GREEN
Residues superimposed below 4.00 A: YELLOW
Residues superimposed below 6.00 A: ORANGE
Residues superimposed below 8.00 A: BROWN
Residues superimposed above 8.00 A or not aligned: RED
Terminal residues not aligned: GREY
Structure Deviation Summary
Calculations based on one final LGA superposition
(Bar representation of 3D plots, TEXT)
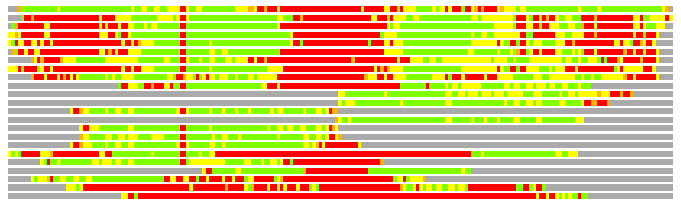
Structures ordered by LGA_S - score
| Structure |
NS |
NT |
N(dist=4.0) |
RMSD(N) |
Seq_ID(N) |
LGA_S |
LGA_Q |
PLOTS |
| 1qu7_A |
227 |
205 |
149 |
2.09 |
14.09 |
56.854 |
6.816 |
T P |
| 2iw5_A |
666 |
205 |
121 |
2.16 |
9.92 |
50.045 |
5.355 |
T P |
| 2h94_A |
647 |
205 |
116 |
1.93 |
9.48 |
48.330 |
5.722 |
T P |
| 2v1d_A |
666 |
205 |
118 |
1.95 |
10.17 |
48.311 |
5.757 |
T P |
| 2z3y_A |
643 |
205 |
117 |
2.13 |
7.69 |
47.675 |
5.258 |
T P |
| 2hko_A |
647 |
205 |
113 |
2.00 |
8.85 |
47.287 |
5.382 |
T P |
| 2ch7_B |
307 |
205 |
127 |
2.50 |
8.66 |
45.229 |
4.884 |
T P |
| 2dw4_A |
634 |
205 |
113 |
2.25 |
7.08 |
44.818 |
4.809 |
T P |
| 2ch7_A |
309 |
205 |
129 |
2.42 |
13.18 |
44.109 |
5.117 |
T P |
| 1qvr_A |
803 |
205 |
95 |
1.93 |
12.63 |
41.105 |
4.681 |
T P |
| 2v71_A |
160 |
205 |
86 |
2.29 |
6.98 |
36.643 |
3.591 |
T P |
| 1c1g_A |
284 |
205 |
79 |
1.87 |
5.06 |
35.493 |
4.016 |
T P |
| 2fxm_A |
126 |
205 |
78 |
1.95 |
10.26 |
34.743 |
3.798 |
T P |
| 2fxo_A |
129 |
205 |
77 |
1.64 |
6.49 |
34.401 |
4.415 |
T P |
| 2b9c_B |
142 |
205 |
75 |
1.75 |
14.67 |
34.106 |
4.055 |
T P |
| 2d3e_A |
130 |
205 |
77 |
2.01 |
11.69 |
33.816 |
3.651 |
T P |
| 2efr_A |
155 |
205 |
75 |
1.88 |
9.33 |
33.680 |
3.784 |
T P |
| 1lrz_A |
400 |
205 |
73 |
1.83 |
9.59 |
31.718 |
3.776 |
T P |
| 1ei3_C |
397 |
205 |
74 |
2.02 |
2.70 |
31.342 |
3.488 |
T P |
| 2wb7_A |
525 |
205 |
62 |
1.50 |
4.84 |
28.509 |
3.864 |
T P |
| 1m1j_C |
390 |
205 |
63 |
2.19 |
15.87 |
23.922 |
2.750 |
T P |
| 1ha0_A |
494 |
205 |
42 |
2.70 |
4.76 |
14.841 |
1.503 |
T P |
| 1bg1_A |
559 |
205 |
14 |
2.60 |
14.29 |
4.845 |
0.518 |
T P |
NS : Total number of residues in Structure (rotated structure)
NT : Total number of residues in TARGET (frame of reference)
N : Total number of residues superimposed under 4.0 Angstrom distance cutoff
RMSD : RMS deviation calculated on all N residues superimposed under 4.0 Angstrom distance cutoff
Seq_Id : Sequence Identity. Percent of identical residues from the total of N aligned.
LGA_S : Structure similarity score calculated by internal LGA procedure (see LGA paper for details)
LGA_Q : Score (how tight is the superposition) calculated by the formula: Q = 0.1*N/(0.1+RMSD)
PLOTS : T - Flat text file (output from LGA program, rotated structure)
PLOTS : P - Plot of superimposed structures (3D plot colored as bars)
Citing LGA:
Zemla A., "LGA - a Method for Finding 3D Similarities in Protein Structures",
Nucleic Acids Research, 2003, Vol. 31, No. 13, pp. 3370-3374.
[MEDLINE]