LGA
Sequence Independent Analysis (LGA)
Frame of reference: Cat.Q2246_545_453.5wLII_11284_13
Total number of 3D structures: 33
LGA calculations using distance cutoff DIST: 4.0 A
Residues superimposed below 2.00 A: GREEN
Residues superimposed below 4.00 A: YELLOW
Residues superimposed below 6.00 A: ORANGE
Residues superimposed below 8.00 A: BROWN
Residues superimposed above 8.00 A or not aligned: RED
Terminal residues not aligned: GREY
Structure Deviation Summary
Calculations based on one final LGA superposition
(Bar representation of 3D plots, TEXT)
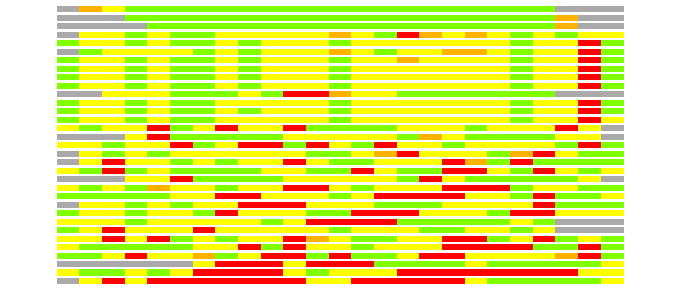
Structures ordered by LGA_S - score
| Structure |
NS |
NT |
N(dist=4.0) |
RMSD(N) |
Seq_ID(N) |
LGA_S |
LGA_Q |
PLOTS |
| 2i9w_A |
177 |
25 |
21 |
1.59 |
47.62 |
83.175 |
1.245 |
T P |
| 1sx0_A |
22 |
25 |
20 |
1.14 |
75.00 |
78.368 |
1.608 |
T P |
| 1ozb_I |
24 |
25 |
19 |
1.35 |
78.95 |
73.965 |
1.311 |
T P |
| 2kau_C |
565 |
25 |
23 |
2.82 |
4.35 |
63.760 |
0.787 |
T P |
| 1a5m_C |
566 |
25 |
24 |
2.71 |
8.33 |
63.612 |
0.855 |
T P |
| 1ejx_C |
555 |
25 |
23 |
2.72 |
4.35 |
63.392 |
0.817 |
T P |
| 1krb_C |
565 |
25 |
24 |
2.71 |
8.33 |
63.384 |
0.853 |
T P |
| 1a5k_C |
566 |
25 |
24 |
2.70 |
8.33 |
63.384 |
0.856 |
T P |
| 1ef2_A |
565 |
25 |
24 |
2.70 |
8.33 |
63.384 |
0.857 |
T P |
| 1a5l_C |
536 |
25 |
24 |
2.70 |
8.33 |
63.384 |
0.858 |
T P |
| 1tf5_A |
775 |
25 |
18 |
2.15 |
11.11 |
63.089 |
0.800 |
T P |
| 1ejt_C |
565 |
25 |
24 |
2.72 |
8.33 |
63.001 |
0.852 |
T P |
| 1ejs_C |
565 |
25 |
24 |
2.71 |
8.33 |
63.001 |
0.854 |
T P |
| 1fwg_C |
565 |
25 |
24 |
2.77 |
8.33 |
62.594 |
0.835 |
T P |
| 2v7p_A |
310 |
25 |
20 |
2.50 |
5.00 |
58.886 |
0.770 |
T P |
| 1fwa_C |
565 |
25 |
20 |
2.35 |
5.00 |
58.842 |
0.817 |
T P |
| 2e37_C |
310 |
25 |
19 |
2.39 |
10.53 |
58.639 |
0.762 |
T P |
| 1m6n_A |
802 |
25 |
22 |
2.68 |
9.09 |
58.339 |
0.792 |
T P |
| 2vda_A |
828 |
25 |
20 |
2.38 |
5.00 |
58.243 |
0.806 |
T P |
| 1nkt_A |
836 |
25 |
20 |
2.39 |
5.00 |
56.654 |
0.802 |
T P |
| 1fwi_C |
550 |
25 |
19 |
2.22 |
5.26 |
56.581 |
0.819 |
T P |
| 2ipc_A |
939 |
25 |
20 |
2.47 |
0.00 |
56.298 |
0.779 |
T P |
| 1ejr_C |
552 |
25 |
18 |
2.24 |
16.67 |
55.459 |
0.770 |
T P |
| 3bxz_B |
440 |
25 |
20 |
2.36 |
5.00 |
55.018 |
0.814 |
T P |
| 3dl8_A |
773 |
25 |
19 |
2.57 |
10.53 |
54.721 |
0.713 |
T P |
| 3din_A |
816 |
25 |
18 |
2.51 |
0.00 |
54.068 |
0.689 |
T P |
| 2jq5_A |
128 |
25 |
20 |
2.65 |
0.00 |
53.927 |
0.728 |
T P |
| 2ibm_A |
780 |
25 |
19 |
2.50 |
0.00 |
51.940 |
0.731 |
T P |
| 2gok_A |
404 |
25 |
18 |
2.44 |
11.11 |
51.877 |
0.709 |
T P |
| 2hfz_A |
608 |
25 |
18 |
2.70 |
5.56 |
47.277 |
0.644 |
T P |
| 1tm6_A |
22 |
25 |
13 |
1.82 |
23.08 |
47.242 |
0.677 |
T P |
| 1jia_A |
122 |
25 |
13 |
2.79 |
0.00 |
35.138 |
0.450 |
T P |
| 1c1j_A |
122 |
25 |
11 |
2.53 |
18.18 |
34.238 |
0.418 |
T P |
NS : Total number of residues in Structure (rotated structure)
NT : Total number of residues in TARGET (frame of reference)
N : Total number of residues superimposed under 4.0 Angstrom distance cutoff
RMSD : RMS deviation calculated on all N residues superimposed under 4.0 Angstrom distance cutoff
Seq_Id : Sequence Identity. Percent of identical residues from the total of N aligned.
LGA_S : Structure similarity score calculated by internal LGA procedure (see LGA paper for details)
LGA_Q : Score (how tight is the superposition) calculated by the formula: Q = 0.1*N/(0.1+RMSD)
PLOTS : T - Flat text file (output from LGA program, rotated structure)
PLOTS : P - Plot of superimposed structures (3D plot colored as bars)
Citing LGA:
Zemla A., "LGA - a Method for Finding 3D Similarities in Protein Structures",
Nucleic Acids Research, 2003, Vol. 31, No. 13, pp. 3370-3374.
[MEDLINE]