LGA
Sequence Independent Analysis (LGA)
Frame of reference: Cat.Q2246_545_454.5wLII_11284_15
Total number of 3D structures: 48
LGA calculations using distance cutoff DIST: 4.0 A
Residues superimposed below 2.00 A: GREEN
Residues superimposed below 4.00 A: YELLOW
Residues superimposed below 6.00 A: ORANGE
Residues superimposed below 8.00 A: BROWN
Residues superimposed above 8.00 A or not aligned: RED
Terminal residues not aligned: GREY
Structure Deviation Summary
Calculations based on one final LGA superposition
(Bar representation of 3D plots, TEXT)
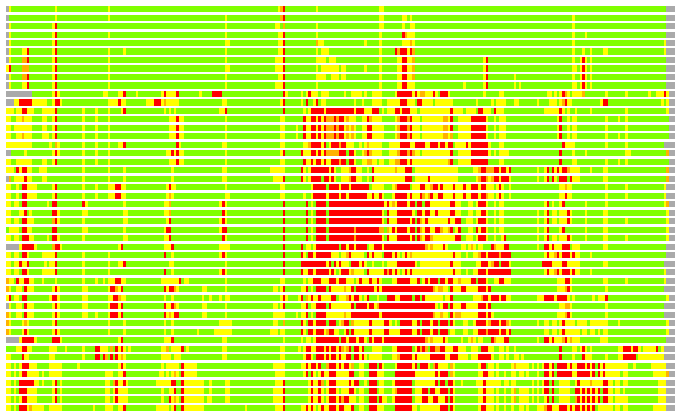
Structures ordered by LGA_S - score
| Structure |
NS |
NT |
N(dist=4.0) |
RMSD(N) |
Seq_ID(N) |
LGA_S |
LGA_Q |
PLOTS |
| 1zoi_A |
275 |
263 |
258 |
0.60 |
21.32 |
97.493 |
36.758 |
T P |
| 1a88_A |
275 |
263 |
258 |
0.89 |
18.99 |
96.338 |
26.168 |
T P |
| 1a8s_A |
273 |
263 |
258 |
1.00 |
18.99 |
95.361 |
23.526 |
T P |
| 1va4_A |
271 |
263 |
256 |
1.09 |
16.41 |
94.263 |
21.437 |
T P |
| 1a8q_A |
274 |
263 |
257 |
1.15 |
17.51 |
94.060 |
20.528 |
T P |
| 3fob_A |
277 |
263 |
251 |
1.26 |
19.12 |
91.720 |
18.469 |
T P |
| 1brt_A |
277 |
263 |
252 |
1.33 |
17.46 |
91.208 |
17.647 |
T P |
| 1a8u_A |
277 |
263 |
253 |
1.40 |
17.39 |
91.033 |
16.832 |
T P |
| 1bro_A |
277 |
263 |
252 |
1.33 |
17.46 |
91.015 |
17.573 |
T P |
| 1hkh_A |
279 |
263 |
252 |
1.32 |
18.65 |
90.718 |
17.689 |
T P |
| 1m33_A |
256 |
263 |
228 |
1.82 |
17.54 |
78.450 |
11.900 |
T P |
| 1wom_A |
271 |
263 |
236 |
1.85 |
19.92 |
75.215 |
12.102 |
T P |
| 1j1i_A |
258 |
263 |
223 |
1.86 |
17.04 |
75.072 |
11.379 |
T P |
| 2pu6_A |
283 |
263 |
238 |
2.01 |
13.87 |
68.236 |
11.288 |
T P |
| 2puj_A |
283 |
263 |
237 |
2.00 |
13.92 |
68.144 |
11.297 |
T P |
| 2rhw_A |
283 |
263 |
238 |
2.03 |
13.87 |
67.553 |
11.185 |
T P |
| 2vf2_A |
284 |
263 |
223 |
1.78 |
14.80 |
67.398 |
11.855 |
T P |
| 1u2e_A |
286 |
263 |
231 |
1.97 |
15.15 |
66.997 |
11.153 |
T P |
| 2og1_A |
285 |
263 |
234 |
1.94 |
14.53 |
66.949 |
11.476 |
T P |
| 2zjf_A |
346 |
263 |
231 |
2.05 |
17.75 |
65.250 |
10.725 |
T P |
| 2e3j_A |
346 |
263 |
230 |
2.01 |
18.26 |
65.130 |
10.917 |
T P |
| 2d0d_A |
271 |
263 |
217 |
1.88 |
17.97 |
64.917 |
10.963 |
T P |
| 1iup_A |
271 |
263 |
216 |
1.92 |
17.59 |
64.814 |
10.671 |
T P |
| 1mtz_A |
290 |
263 |
209 |
1.66 |
17.70 |
64.276 |
11.846 |
T P |
| 1xro_A |
290 |
263 |
212 |
1.73 |
18.40 |
64.274 |
11.588 |
T P |
| 1xrl_A |
290 |
263 |
212 |
1.75 |
16.98 |
64.174 |
11.471 |
T P |
| 1xqv_A |
290 |
263 |
209 |
1.73 |
18.18 |
64.119 |
11.397 |
T P |
| 1xrr_A |
290 |
263 |
210 |
1.74 |
17.62 |
63.625 |
11.441 |
T P |
| 3bf7_A |
255 |
263 |
198 |
1.70 |
20.20 |
63.339 |
11.002 |
T P |
| 3cxu_A |
320 |
263 |
220 |
1.97 |
17.73 |
63.258 |
10.644 |
T P |
| 1ehy_A |
282 |
263 |
215 |
1.87 |
17.21 |
63.112 |
10.930 |
T P |
| 2cjp_A |
320 |
263 |
217 |
1.94 |
17.05 |
62.559 |
10.653 |
T P |
| 1c4x_A |
281 |
263 |
219 |
1.97 |
13.24 |
62.519 |
10.594 |
T P |
| 2ocl_A |
254 |
263 |
207 |
1.88 |
18.84 |
62.386 |
10.464 |
T P |
| 1y37_A |
294 |
263 |
216 |
1.92 |
18.06 |
62.210 |
10.680 |
T P |
| 2ocg_A |
254 |
263 |
205 |
1.82 |
18.54 |
62.206 |
10.677 |
T P |
| 2ock_A |
254 |
263 |
208 |
1.96 |
18.75 |
62.015 |
10.097 |
T P |
| 1zd3_A |
547 |
263 |
220 |
2.00 |
16.82 |
61.534 |
10.489 |
T P |
| 1cqz_B |
541 |
263 |
221 |
1.97 |
17.65 |
61.310 |
10.697 |
T P |
| 3bf8_A |
255 |
263 |
201 |
1.76 |
19.90 |
61.123 |
10.820 |
T P |
| 1wm1_A |
313 |
263 |
214 |
2.08 |
17.29 |
59.601 |
9.839 |
T P |
| 1azw_A |
313 |
263 |
212 |
2.08 |
18.40 |
59.438 |
9.717 |
T P |
| 2v9z_A |
302 |
263 |
213 |
2.09 |
15.49 |
58.818 |
9.709 |
T P |
| 1cqw_A |
295 |
263 |
215 |
2.13 |
15.81 |
58.425 |
9.628 |
T P |
| 1mj5_A |
297 |
263 |
217 |
2.20 |
17.05 |
57.763 |
9.432 |
T P |
| 1cv2_A |
293 |
263 |
216 |
2.12 |
15.74 |
57.741 |
9.715 |
T P |
| 1iz7_A |
294 |
263 |
218 |
2.17 |
16.06 |
57.513 |
9.621 |
T P |
| 1bn6_A |
291 |
263 |
217 |
2.17 |
15.21 |
57.367 |
9.557 |
T P |
NS : Total number of residues in Structure (rotated structure)
NT : Total number of residues in TARGET (frame of reference)
N : Total number of residues superimposed under 4.0 Angstrom distance cutoff
RMSD : RMS deviation calculated on all N residues superimposed under 4.0 Angstrom distance cutoff
Seq_Id : Sequence Identity. Percent of identical residues from the total of N aligned.
LGA_S : Structure similarity score calculated by internal LGA procedure (see LGA paper for details)
LGA_Q : Score (how tight is the superposition) calculated by the formula: Q = 0.1*N/(0.1+RMSD)
PLOTS : T - Flat text file (output from LGA program, rotated structure)
PLOTS : P - Plot of superimposed structures (3D plot colored as bars)
Citing LGA:
Zemla A., "LGA - a Method for Finding 3D Similarities in Protein Structures",
Nucleic Acids Research, 2003, Vol. 31, No. 13, pp. 3370-3374.
[MEDLINE]