LGA
Sequence Independent Analysis (LGA)
Frame of reference: Cat.Q2246_545_465.5wLII_11346_30
Total number of 3D structures: 41
LGA calculations using distance cutoff DIST: 4.0 A
Residues superimposed below 2.00 A: GREEN
Residues superimposed below 4.00 A: YELLOW
Residues superimposed below 6.00 A: ORANGE
Residues superimposed below 8.00 A: BROWN
Residues superimposed above 8.00 A or not aligned: RED
Terminal residues not aligned: GREY
Structure Deviation Summary
Calculations based on one final LGA superposition
(Bar representation of 3D plots, TEXT)
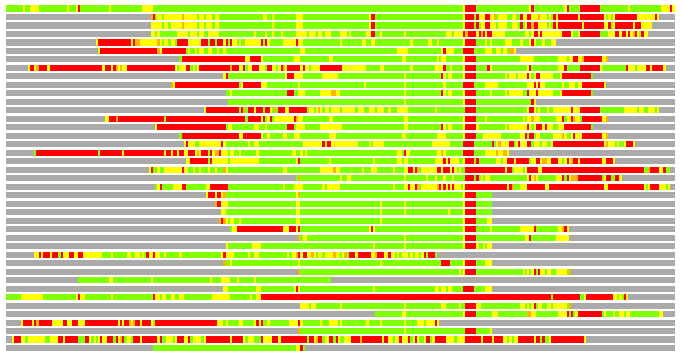
Structures ordered by LGA_S - score
| Structure |
NS |
NT |
N(dist=4.0) |
RMSD(N) |
Seq_ID(N) |
LGA_S |
LGA_Q |
PLOTS |
| 1w3b_A |
388 |
304 |
286 |
1.14 |
14.69 |
90.185 |
23.080 |
T P |
| 2ho1_A |
222 |
304 |
186 |
1.99 |
6.99 |
52.640 |
8.915 |
T P |
| 2fi7_A |
223 |
304 |
181 |
1.91 |
7.18 |
52.273 |
9.006 |
T P |
| 2vq2_A |
220 |
304 |
192 |
2.09 |
6.25 |
49.302 |
8.772 |
T P |
| 2q7f_A |
194 |
304 |
169 |
2.07 |
13.02 |
45.608 |
7.801 |
T P |
| 3cv0_A |
300 |
304 |
147 |
1.72 |
6.80 |
44.919 |
8.064 |
T P |
| 2c0l_A |
292 |
304 |
146 |
1.64 |
8.90 |
44.765 |
8.377 |
T P |
| 2gw1_A |
487 |
304 |
165 |
2.28 |
7.27 |
43.764 |
6.937 |
T P |
| 1e96_B |
185 |
304 |
142 |
1.69 |
4.93 |
43.557 |
7.952 |
T P |
| 3cvq_A |
289 |
304 |
144 |
1.70 |
6.94 |
43.527 |
7.995 |
T P |
| 1hh8_A |
192 |
304 |
143 |
1.73 |
4.90 |
43.457 |
7.805 |
T P |
| 2fo7_A |
136 |
304 |
134 |
1.01 |
10.45 |
42.674 |
12.024 |
T P |
| 2pl2_A |
194 |
304 |
155 |
2.09 |
7.10 |
42.288 |
7.077 |
T P |
| 2c0m_C |
302 |
304 |
144 |
1.99 |
9.72 |
42.263 |
6.877 |
T P |
| 1wm5_A |
205 |
304 |
142 |
1.86 |
4.93 |
42.153 |
7.257 |
T P |
| 1fch_A |
302 |
304 |
143 |
1.91 |
8.39 |
41.853 |
7.104 |
T P |
| 1xnf_B |
262 |
304 |
163 |
2.15 |
7.98 |
41.678 |
7.248 |
T P |
| 2j9q_A |
300 |
304 |
140 |
1.94 |
8.57 |
41.211 |
6.856 |
T P |
| 3edt_B |
258 |
304 |
148 |
2.14 |
8.78 |
40.495 |
6.608 |
T P |
| 2vsy_A |
547 |
304 |
150 |
2.14 |
6.67 |
39.255 |
6.692 |
T P |
| 2c2l_A |
281 |
304 |
125 |
1.70 |
8.80 |
38.029 |
6.954 |
T P |
| 2vsn_A |
534 |
304 |
144 |
2.09 |
5.56 |
37.846 |
6.587 |
T P |
| 1ihg_A |
364 |
304 |
120 |
1.31 |
8.33 |
37.765 |
8.482 |
T P |
| 1p5q_A |
283 |
304 |
119 |
1.28 |
6.72 |
37.633 |
8.626 |
T P |
| 1qz2_A |
285 |
304 |
118 |
1.21 |
6.78 |
37.496 |
8.993 |
T P |
| 1kt1_A |
374 |
304 |
118 |
1.29 |
9.32 |
37.438 |
8.513 |
T P |
| 2dba_A |
148 |
304 |
121 |
1.56 |
6.61 |
36.842 |
7.308 |
T P |
| 2vyi_A |
128 |
304 |
117 |
1.40 |
6.84 |
36.447 |
7.823 |
T P |
| 1na0_A |
119 |
304 |
116 |
1.20 |
10.34 |
36.424 |
8.956 |
T P |
| 3ceq_B |
269 |
304 |
148 |
2.25 |
8.78 |
36.345 |
6.288 |
T P |
| 1kt0_A |
357 |
304 |
113 |
1.22 |
9.73 |
36.200 |
8.592 |
T P |
| 1a17_A |
159 |
304 |
117 |
1.44 |
8.55 |
36.036 |
7.620 |
T P |
| 1elw_A |
117 |
304 |
115 |
1.25 |
12.17 |
35.985 |
8.504 |
T P |
| 2fbn_A |
153 |
304 |
116 |
1.41 |
7.76 |
35.785 |
7.706 |
T P |
| 1wao_1 |
471 |
304 |
124 |
1.82 |
10.48 |
35.661 |
6.471 |
T P |
| 2bug_A |
131 |
304 |
117 |
1.68 |
9.40 |
34.678 |
6.557 |
T P |
| 1elr_A |
128 |
304 |
113 |
1.66 |
8.85 |
34.082 |
6.434 |
T P |
| 2if4_A |
258 |
304 |
118 |
2.16 |
5.93 |
32.305 |
5.227 |
T P |
| 1na3_A |
86 |
304 |
83 |
1.17 |
10.84 |
26.512 |
6.550 |
T P |
| 1ouv_A |
265 |
304 |
123 |
2.63 |
10.57 |
25.366 |
4.498 |
T P |
| 2avp_A |
68 |
304 |
68 |
0.87 |
7.35 |
21.983 |
7.044 |
T P |
NS : Total number of residues in Structure (rotated structure)
NT : Total number of residues in TARGET (frame of reference)
N : Total number of residues superimposed under 4.0 Angstrom distance cutoff
RMSD : RMS deviation calculated on all N residues superimposed under 4.0 Angstrom distance cutoff
Seq_Id : Sequence Identity. Percent of identical residues from the total of N aligned.
LGA_S : Structure similarity score calculated by internal LGA procedure (see LGA paper for details)
LGA_Q : Score (how tight is the superposition) calculated by the formula: Q = 0.1*N/(0.1+RMSD)
PLOTS : T - Flat text file (output from LGA program, rotated structure)
PLOTS : P - Plot of superimposed structures (3D plot colored as bars)
Citing LGA:
Zemla A., "LGA - a Method for Finding 3D Similarities in Protein Structures",
Nucleic Acids Research, 2003, Vol. 31, No. 13, pp. 3370-3374.
[MEDLINE]