LGA
Sequence Independent Analysis (LGA)
Frame of reference: Cat.Q2246_545_490.5wLII_11346_167
Total number of 3D structures: 41
LGA calculations using distance cutoff DIST: 4.0 A
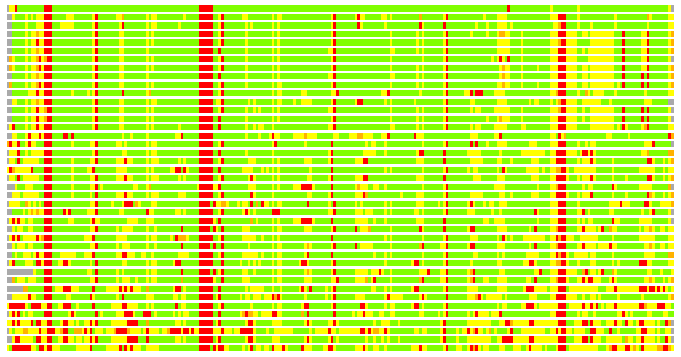
Residues superimposed below 2.00 A: GREEN
Residues superimposed below 4.00 A: YELLOW
Residues superimposed below 6.00 A: ORANGE
Residues superimposed below 8.00 A: BROWN
Residues superimposed above 8.00 A or not aligned: RED
Terminal residues not aligned: GREY
Structure Deviation Summary
Calculations based on one final LGA superposition
(Bar representation of 3D plots, TEXT)
Structures ordered by LGA_S - score
| Structure |
NS |
NT |
N(dist=4.0) |
RMSD(N) |
Seq_ID(N) |
LGA_S |
LGA_Q |
PLOTS |
| 1l0q_A |
391 |
249 |
237 |
0.56 |
24.05 |
94.587 |
35.819 |
T P |
| 3dm0_A |
675 |
249 |
231 |
1.60 |
13.85 |
85.225 |
13.555 |
T P |
| 3frx_B |
313 |
249 |
230 |
1.56 |
14.35 |
85.067 |
13.892 |
T P |
| 2h6n_B |
305 |
249 |
230 |
1.68 |
10.43 |
84.963 |
12.890 |
T P |
| 2h9m_A |
304 |
249 |
230 |
1.66 |
10.43 |
84.957 |
13.084 |
T P |
| 2gnq_A |
316 |
249 |
230 |
1.67 |
10.43 |
84.820 |
12.967 |
T P |
| 2cnx_A |
306 |
249 |
228 |
1.66 |
10.53 |
84.686 |
12.988 |
T P |
| 2co0_A |
304 |
249 |
230 |
1.71 |
10.43 |
84.607 |
12.673 |
T P |
| 2h9l_A |
321 |
249 |
229 |
1.67 |
10.48 |
84.566 |
12.947 |
T P |
| 2g99_A |
304 |
249 |
229 |
1.67 |
10.48 |
84.522 |
12.955 |
T P |
| 1gxr_A |
335 |
249 |
225 |
1.60 |
12.44 |
84.174 |
13.272 |
T P |
| 3fm0_A |
328 |
249 |
229 |
1.73 |
12.66 |
84.119 |
12.502 |
T P |
| 3emh_A |
300 |
249 |
229 |
1.69 |
10.48 |
84.115 |
12.763 |
T P |
| 2g9a_A |
310 |
249 |
228 |
1.65 |
10.53 |
84.103 |
13.047 |
T P |
| 2h14_A |
303 |
249 |
229 |
1.70 |
10.48 |
83.987 |
12.723 |
T P |
| 3bws_A |
407 |
249 |
227 |
1.83 |
13.66 |
83.558 |
11.763 |
T P |
| 1erj_C |
357 |
249 |
226 |
1.56 |
8.85 |
83.356 |
13.595 |
T P |
| 1vyh_C |
310 |
249 |
226 |
1.72 |
7.96 |
82.852 |
12.449 |
T P |
| 3cfv_B |
393 |
249 |
225 |
1.78 |
13.78 |
81.813 |
11.942 |
T P |
| 2bcj_B |
339 |
249 |
229 |
1.89 |
10.92 |
81.602 |
11.484 |
T P |
| 3cfs_B |
383 |
249 |
224 |
1.80 |
13.84 |
81.419 |
11.815 |
T P |
| 1tbg_A |
340 |
249 |
225 |
1.77 |
10.67 |
81.313 |
12.064 |
T P |
| 3c99_A |
380 |
249 |
226 |
1.83 |
14.16 |
81.300 |
11.701 |
T P |
| 1nr0_A |
610 |
249 |
224 |
1.82 |
12.95 |
81.109 |
11.666 |
T P |
| 2hes_X |
308 |
249 |
221 |
1.75 |
11.76 |
80.904 |
11.970 |
T P |
| 1a0r_B |
339 |
249 |
225 |
1.80 |
9.78 |
80.874 |
11.843 |
T P |
| 2pm6_D |
288 |
249 |
224 |
1.83 |
11.16 |
80.795 |
11.593 |
T P |
| 1got_B |
339 |
249 |
228 |
1.94 |
11.40 |
80.698 |
11.162 |
T P |
| 2pm7_D |
288 |
249 |
224 |
1.85 |
9.82 |
80.578 |
11.478 |
T P |
| 2pbi_D |
354 |
249 |
228 |
1.92 |
13.60 |
79.824 |
11.299 |
T P |
| 1p22_A |
402 |
249 |
218 |
1.70 |
10.09 |
79.377 |
12.099 |
T P |
| 3bg1_A |
285 |
249 |
217 |
1.84 |
10.14 |
78.428 |
11.175 |
T P |
| 2pm9_B |
280 |
249 |
224 |
1.95 |
11.16 |
74.438 |
10.925 |
T P |
| 2ovr_B |
442 |
249 |
205 |
1.99 |
11.22 |
71.435 |
9.786 |
T P |
| 2pm9_A |
384 |
249 |
224 |
1.95 |
11.16 |
69.859 |
10.929 |
T P |
| 1nex_B |
444 |
249 |
201 |
2.00 |
11.94 |
69.099 |
9.587 |
T P |
| 3ei4_B |
368 |
249 |
215 |
1.91 |
10.70 |
67.116 |
10.709 |
T P |
| 2b4e_A |
386 |
249 |
207 |
2.24 |
10.14 |
59.758 |
8.836 |
T P |
| 2zkq_a |
306 |
249 |
199 |
2.55 |
8.04 |
59.643 |
7.516 |
T P |
| 2aq5_A |
395 |
249 |
206 |
2.23 |
9.22 |
59.544 |
8.833 |
T P |
| 1r5m_A |
351 |
249 |
205 |
2.27 |
7.32 |
56.482 |
8.643 |
T P |
NS : Total number of residues in Structure (rotated structure)
NT : Total number of residues in TARGET (frame of reference)
N : Total number of residues superimposed under 4.0 Angstrom distance cutoff
RMSD : RMS deviation calculated on all N residues superimposed under 4.0 Angstrom distance cutoff
Seq_Id : Sequence Identity. Percent of identical residues from the total of N aligned.
LGA_S : Structure similarity score calculated by internal LGA procedure (see LGA paper for details)
LGA_Q : Score (how tight is the superposition) calculated by the formula: Q = 0.1*N/(0.1+RMSD)
PLOTS : T - Flat text file (output from LGA program, rotated structure)
PLOTS : P - Plot of superimposed structures (3D plot colored as bars)
Citing LGA:
Zemla A., "LGA - a Method for Finding 3D Similarities in Protein Structures",
Nucleic Acids Research, 2003, Vol. 31, No. 13, pp. 3370-3374.
[MEDLINE]