LGA
Sequence Independent Analysis (LGA)
Frame of reference: Cat.Q2246_545_498.5wLII_11364_17
Total number of 3D structures: 10
LGA calculations using distance cutoff DIST: 4.0 A
Residues superimposed below 2.00 A: GREEN
Residues superimposed below 4.00 A: YELLOW
Residues superimposed below 6.00 A: ORANGE
Residues superimposed below 8.00 A: BROWN
Residues superimposed above 8.00 A or not aligned: RED
Terminal residues not aligned: GREY
Structure Deviation Summary
Calculations based on one final LGA superposition
(Bar representation of 3D plots, TEXT)
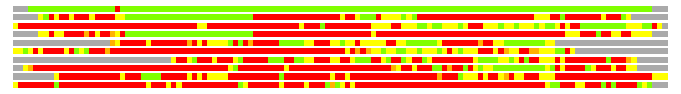
Structures ordered by LGA_S - score
| Structure |
NS |
NT |
N(dist=4.0) |
RMSD(N) |
Seq_ID(N) |
LGA_S |
LGA_Q |
PLOTS |
| 1ng6_A |
148 |
128 |
121 |
0.24 |
35.54 |
95.241 |
36.073 |
T P |
| 1zq1_C |
508 |
128 |
51 |
2.03 |
5.88 |
31.749 |
2.395 |
T P |
| 2hvr_A |
319 |
128 |
53 |
2.51 |
20.75 |
30.848 |
2.029 |
T P |
| 2d6f_D |
522 |
128 |
44 |
2.13 |
9.09 |
28.343 |
1.973 |
T P |
| 1gtm_A |
417 |
128 |
51 |
2.65 |
13.73 |
27.216 |
1.854 |
T P |
| 3evr_A |
397 |
128 |
45 |
2.96 |
11.11 |
24.449 |
1.471 |
T P |
| 2hvq_A |
316 |
128 |
42 |
2.23 |
2.38 |
23.443 |
1.805 |
T P |
| 2f2a_B |
408 |
128 |
34 |
2.48 |
2.94 |
19.901 |
1.318 |
T P |
| 3ek8_A |
393 |
128 |
31 |
2.91 |
3.23 |
15.147 |
1.029 |
T P |
| 3evu_A |
393 |
128 |
24 |
2.63 |
0.00 |
13.177 |
0.878 |
T P |
NS : Total number of residues in Structure (rotated structure)
NT : Total number of residues in TARGET (frame of reference)
N : Total number of residues superimposed under 4.0 Angstrom distance cutoff
RMSD : RMS deviation calculated on all N residues superimposed under 4.0 Angstrom distance cutoff
Seq_Id : Sequence Identity. Percent of identical residues from the total of N aligned.
LGA_S : Structure similarity score calculated by internal LGA procedure (see LGA paper for details)
LGA_Q : Score (how tight is the superposition) calculated by the formula: Q = 0.1*N/(0.1+RMSD)
PLOTS : T - Flat text file (output from LGA program, rotated structure)
PLOTS : P - Plot of superimposed structures (3D plot colored as bars)
Citing LGA:
Zemla A., "LGA - a Method for Finding 3D Similarities in Protein Structures",
Nucleic Acids Research, 2003, Vol. 31, No. 13, pp. 3370-3374.
[MEDLINE]