LGA
Sequence Independent Analysis (LGA)
Frame of reference: Cat.Q2246_545_502.5wLII_11364_28
Total number of 3D structures: 17
LGA calculations using distance cutoff DIST: 4.0 A
Residues superimposed below 2.00 A: GREEN
Residues superimposed below 4.00 A: YELLOW
Residues superimposed below 6.00 A: ORANGE
Residues superimposed below 8.00 A: BROWN
Residues superimposed above 8.00 A or not aligned: RED
Terminal residues not aligned: GREY
Structure Deviation Summary
Calculations based on one final LGA superposition
(Bar representation of 3D plots, TEXT)
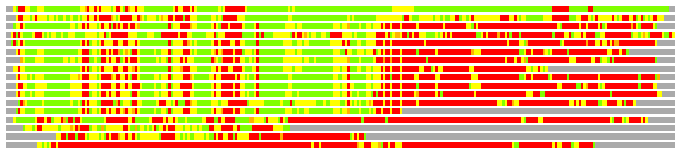
Structures ordered by LGA_S - score
| Structure |
NS |
NT |
N(dist=4.0) |
RMSD(N) |
Seq_ID(N) |
LGA_S |
LGA_Q |
PLOTS |
| 3dma_A |
340 |
280 |
243 |
1.66 |
18.93 |
81.502 |
13.793 |
T P |
| 3dev_A |
316 |
280 |
214 |
2.32 |
18.22 |
53.608 |
8.854 |
T P |
| 2haw_B |
308 |
280 |
149 |
2.21 |
14.77 |
38.057 |
6.443 |
T P |
| 1ir6_A |
385 |
280 |
164 |
2.47 |
15.85 |
37.519 |
6.382 |
T P |
| 2iw4_B |
308 |
280 |
148 |
2.33 |
15.54 |
37.222 |
6.087 |
T P |
| 1i74_A |
309 |
280 |
149 |
2.31 |
15.44 |
36.946 |
6.182 |
T P |
| 2eb0_B |
307 |
280 |
146 |
2.35 |
14.38 |
36.496 |
5.947 |
T P |
| 1k23_C |
308 |
280 |
150 |
2.31 |
14.67 |
36.458 |
6.236 |
T P |
| 1k20_A |
310 |
280 |
147 |
2.31 |
17.01 |
36.411 |
6.097 |
T P |
| 2enx_A |
310 |
280 |
144 |
2.28 |
18.75 |
36.003 |
6.059 |
T P |
| 1wpp_A |
310 |
280 |
142 |
2.26 |
17.61 |
35.390 |
6.027 |
T P |
| 2qb7_A |
393 |
280 |
146 |
2.34 |
10.27 |
34.852 |
5.979 |
T P |
| 1wpn_A |
187 |
280 |
132 |
2.15 |
17.42 |
34.381 |
5.875 |
T P |
| 3g68_B |
351 |
280 |
91 |
2.36 |
8.79 |
21.839 |
3.703 |
T P |
| 2d59_A |
141 |
280 |
81 |
2.65 |
9.88 |
17.287 |
2.946 |
T P |
| 2h06_B |
308 |
280 |
61 |
2.71 |
11.48 |
14.851 |
2.172 |
T P |
| 2fic_B |
201 |
280 |
31 |
2.78 |
3.23 |
7.565 |
1.075 |
T P |
NS : Total number of residues in Structure (rotated structure)
NT : Total number of residues in TARGET (frame of reference)
N : Total number of residues superimposed under 4.0 Angstrom distance cutoff
RMSD : RMS deviation calculated on all N residues superimposed under 4.0 Angstrom distance cutoff
Seq_Id : Sequence Identity. Percent of identical residues from the total of N aligned.
LGA_S : Structure similarity score calculated by internal LGA procedure (see LGA paper for details)
LGA_Q : Score (how tight is the superposition) calculated by the formula: Q = 0.1*N/(0.1+RMSD)
PLOTS : T - Flat text file (output from LGA program, rotated structure)
PLOTS : P - Plot of superimposed structures (3D plot colored as bars)
Citing LGA:
Zemla A., "LGA - a Method for Finding 3D Similarities in Protein Structures",
Nucleic Acids Research, 2003, Vol. 31, No. 13, pp. 3370-3374.
[MEDLINE]