LGA
Sequence Independent Analysis (LGA)
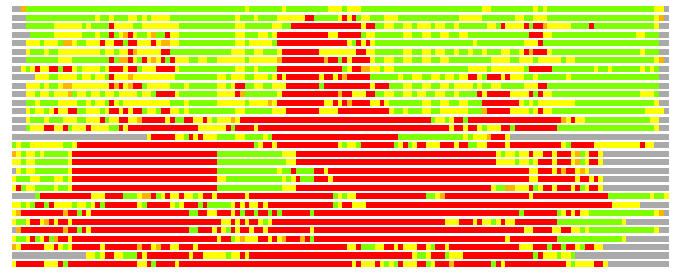
Frame of reference: Cat.Q2246_545_538.5wLII_11390_77
Total number of 3D structures: 31
LGA calculations using distance cutoff DIST: 4.0 A
Residues superimposed below 2.00 A: GREEN
Residues superimposed below 4.00 A: YELLOW
Residues superimposed below 6.00 A: ORANGE
Residues superimposed below 8.00 A: BROWN
Residues superimposed above 8.00 A or not aligned: RED
Terminal residues not aligned: GREY
Structure Deviation Summary
Calculations based on one final LGA superposition
(Bar representation of 3D plots, TEXT)

Structures ordered by LGA_S - score
| Structure |
NS |
NT |
N(dist=4.0) |
RMSD(N) |
Seq_ID(N) |
LGA_S |
LGA_Q |
PLOTS |
| 2rd9_A |
189 |
141 |
138 |
1.21 |
20.29 |
94.457 |
10.560 |
T P |
| 1rxq_B |
175 |
141 |
133 |
1.81 |
16.54 |
84.782 |
6.950 |
T P |
| 2yqy_A |
126 |
141 |
113 |
1.99 |
15.93 |
66.287 |
5.397 |
T P |
| 3cex_A |
170 |
141 |
113 |
1.89 |
15.93 |
65.406 |
5.666 |
T P |
| 3di5_A |
150 |
141 |
112 |
2.02 |
16.07 |
63.762 |
5.279 |
T P |
| 2ou6_A |
183 |
141 |
119 |
2.15 |
13.45 |
61.644 |
5.286 |
T P |
| 2p1a_B |
150 |
141 |
116 |
2.19 |
12.07 |
59.803 |
5.073 |
T P |
| 2qnl_A |
162 |
141 |
102 |
1.99 |
16.67 |
56.209 |
4.878 |
T P |
| 3e4x_A |
157 |
141 |
111 |
2.27 |
15.32 |
55.758 |
4.677 |
T P |
| 3dka_B |
144 |
141 |
108 |
2.17 |
17.59 |
55.477 |
4.748 |
T P |
| 2qe9_A |
165 |
141 |
107 |
2.24 |
12.15 |
53.660 |
4.574 |
T P |
| 2hkv_A |
148 |
141 |
110 |
2.26 |
11.82 |
52.361 |
4.668 |
T P |
| 2f22_B |
143 |
141 |
103 |
2.23 |
16.50 |
51.473 |
4.418 |
T P |
| 1w3z_A |
181 |
141 |
60 |
2.36 |
10.00 |
29.797 |
2.441 |
T P |
| 1w33_A |
181 |
141 |
55 |
2.37 |
10.91 |
27.978 |
2.223 |
T P |
| 1q3u_A |
332 |
141 |
41 |
2.08 |
7.32 |
25.178 |
1.884 |
T P |
| 1kkj_A |
405 |
141 |
49 |
2.60 |
8.16 |
24.083 |
1.812 |
T P |
| 1kbu_A |
324 |
141 |
45 |
2.26 |
11.11 |
23.829 |
1.903 |
T P |
| 1pvr_A |
324 |
141 |
45 |
2.24 |
11.11 |
23.627 |
1.927 |
T P |
| 1xo0_A |
322 |
141 |
40 |
2.09 |
10.00 |
23.409 |
1.827 |
T P |
| 2crx_B |
309 |
141 |
39 |
1.99 |
12.82 |
22.597 |
1.863 |
T P |
| 3crx_A |
323 |
141 |
44 |
2.21 |
11.36 |
22.535 |
1.901 |
T P |
| 2hof_B |
316 |
141 |
43 |
2.60 |
6.98 |
20.422 |
1.595 |
T P |
| 1xns_A |
322 |
141 |
43 |
2.74 |
4.65 |
20.269 |
1.516 |
T P |
| 1pvp_A |
323 |
141 |
37 |
2.42 |
13.51 |
20.016 |
1.470 |
T P |
| 1f44_A |
316 |
141 |
40 |
2.53 |
5.00 |
19.877 |
1.519 |
T P |
| 3c29_A |
322 |
141 |
36 |
2.54 |
5.56 |
19.411 |
1.363 |
T P |
| 5crx_A |
297 |
141 |
37 |
2.35 |
10.81 |
18.992 |
1.510 |
T P |
| 1drg_A |
313 |
141 |
37 |
2.92 |
8.11 |
17.306 |
1.227 |
T P |
| 1zel_B |
295 |
141 |
36 |
2.64 |
13.89 |
16.413 |
1.315 |
T P |
| 4crx_A |
322 |
141 |
32 |
2.89 |
6.25 |
16.027 |
1.070 |
T P |
NS : Total number of residues in Structure (rotated structure)
NT : Total number of residues in TARGET (frame of reference)
N : Total number of residues superimposed under 4.0 Angstrom distance cutoff
RMSD : RMS deviation calculated on all N residues superimposed under 4.0 Angstrom distance cutoff
Seq_Id : Sequence Identity. Percent of identical residues from the total of N aligned.
LGA_S : Structure similarity score calculated by internal LGA procedure (see LGA paper for details)
LGA_Q : Score (how tight is the superposition) calculated by the formula: Q = 0.1*N/(0.1+RMSD)
PLOTS : T - Flat text file (output from LGA program, rotated structure)
PLOTS : P - Plot of superimposed structures (3D plot colored as bars)
Citing LGA:
Zemla A., "LGA - a Method for Finding 3D Similarities in Protein Structures",
Nucleic Acids Research, 2003, Vol. 31, No. 13, pp. 3370-3374.
[MEDLINE]

