LGA
Sequence Independent Analysis (LGA)
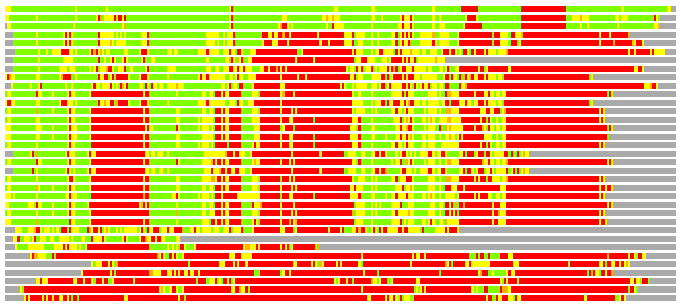
Frame of reference: Cat.Q2246_545_54.5wLII_10954_19
Total number of 3D structures: 35
LGA calculations using distance cutoff DIST: 4.0 A
Residues superimposed below 2.00 A: GREEN
Residues superimposed below 4.00 A: YELLOW
Residues superimposed below 6.00 A: ORANGE
Residues superimposed below 8.00 A: BROWN
Residues superimposed above 8.00 A or not aligned: RED
Terminal residues not aligned: GREY
Structure Deviation Summary
Calculations based on one final LGA superposition
(Bar representation of 3D plots, TEXT)

Structures ordered by LGA_S - score
| Structure |
NS |
NT |
N(dist=4.0) |
RMSD(N) |
Seq_ID(N) |
LGA_S |
LGA_Q |
PLOTS |
| 1xhb_A |
447 |
326 |
293 |
0.88 |
21.16 |
88.095 |
29.871 |
T P |
| 2ffu_A |
494 |
326 |
284 |
1.54 |
17.25 |
81.746 |
17.302 |
T P |
| 2d7i_A |
536 |
326 |
282 |
1.43 |
20.21 |
81.274 |
18.443 |
T P |
| 2z86_C |
603 |
326 |
187 |
2.13 |
12.83 |
42.841 |
8.401 |
T P |
| 2z87_A |
601 |
326 |
187 |
2.10 |
12.83 |
42.571 |
8.487 |
T P |
| 2bo4_A |
380 |
326 |
173 |
2.33 |
10.40 |
35.668 |
7.107 |
T P |
| 3bcv_A |
196 |
326 |
145 |
2.06 |
21.38 |
35.396 |
6.719 |
T P |
| 1qg8_A |
238 |
326 |
169 |
2.17 |
19.53 |
35.177 |
7.434 |
T P |
| 3ckj_A |
300 |
326 |
159 |
2.27 |
16.98 |
34.640 |
6.703 |
T P |
| 2apc_A |
342 |
326 |
164 |
2.21 |
8.54 |
33.772 |
7.107 |
T P |
| 1nmm_B |
272 |
326 |
150 |
2.11 |
11.33 |
33.509 |
6.786 |
T P |
| 3e26_A |
274 |
326 |
160 |
2.31 |
16.25 |
33.494 |
6.639 |
T P |
| 1yro_B |
272 |
326 |
149 |
2.17 |
12.08 |
33.395 |
6.553 |
T P |
| 1j94_B |
271 |
326 |
152 |
2.15 |
12.50 |
33.187 |
6.764 |
T P |
| 1jn8_B |
271 |
326 |
152 |
2.17 |
11.84 |
33.038 |
6.697 |
T P |
| 2fyd_B |
272 |
326 |
153 |
2.17 |
11.76 |
32.861 |
6.728 |
T P |
| 1j8w_B |
271 |
326 |
148 |
2.06 |
11.49 |
32.820 |
6.847 |
T P |
| 2nxv_A |
249 |
326 |
153 |
2.20 |
14.38 |
32.819 |
6.665 |
T P |
| 2fyc_B |
272 |
326 |
150 |
2.16 |
12.67 |
32.776 |
6.627 |
T P |
| 2qgi_A |
248 |
326 |
154 |
2.16 |
14.94 |
32.710 |
6.824 |
T P |
| 1nhe_B |
272 |
326 |
150 |
2.19 |
10.00 |
32.634 |
6.545 |
T P |
| 1pzt_A |
271 |
326 |
143 |
2.15 |
12.59 |
32.339 |
6.344 |
T P |
| 1nf5_B |
272 |
326 |
152 |
2.19 |
11.84 |
32.099 |
6.628 |
T P |
| 1fgx_B |
273 |
326 |
142 |
2.11 |
12.68 |
31.935 |
6.414 |
T P |
| 2fy7_A |
268 |
326 |
142 |
2.08 |
13.38 |
31.918 |
6.505 |
T P |
| 1fr8_A |
271 |
326 |
144 |
2.16 |
12.50 |
31.599 |
6.364 |
T P |
| 2ux8_G |
288 |
326 |
138 |
2.58 |
6.52 |
25.884 |
5.155 |
T P |
| 2oil_A |
174 |
326 |
70 |
2.32 |
10.00 |
14.824 |
2.890 |
T P |
| 3g1w_A |
291 |
326 |
67 |
2.38 |
8.96 |
14.686 |
2.698 |
T P |
| 1pjj_A |
271 |
326 |
53 |
2.57 |
7.55 |
10.704 |
1.984 |
T P |
| 3ez1_B |
419 |
326 |
55 |
3.05 |
7.27 |
10.414 |
1.746 |
T P |
| 2bb5_A |
409 |
326 |
48 |
2.80 |
6.25 |
10.098 |
1.658 |
T P |
| 1tdz_A |
265 |
326 |
51 |
2.89 |
5.88 |
9.919 |
1.706 |
T P |
| 3c58_A |
269 |
326 |
43 |
2.71 |
4.65 |
9.205 |
1.531 |
T P |
| 1kfv_A |
264 |
326 |
42 |
2.71 |
7.14 |
8.474 |
1.497 |
T P |
NS : Total number of residues in Structure (rotated structure)
NT : Total number of residues in TARGET (frame of reference)
N : Total number of residues superimposed under 4.0 Angstrom distance cutoff
RMSD : RMS deviation calculated on all N residues superimposed under 4.0 Angstrom distance cutoff
Seq_Id : Sequence Identity. Percent of identical residues from the total of N aligned.
LGA_S : Structure similarity score calculated by internal LGA procedure (see LGA paper for details)
LGA_Q : Score (how tight is the superposition) calculated by the formula: Q = 0.1*N/(0.1+RMSD)
PLOTS : T - Flat text file (output from LGA program, rotated structure)
PLOTS : P - Plot of superimposed structures (3D plot colored as bars)
Citing LGA:
Zemla A., "LGA - a Method for Finding 3D Similarities in Protein Structures",
Nucleic Acids Research, 2003, Vol. 31, No. 13, pp. 3370-3374.
[MEDLINE]

