LGA
Sequence Independent Analysis (LGA)
Frame of reference: Cat.Q2246_545_542.5wLII_11390_92
Total number of 3D structures: 54
LGA calculations using distance cutoff DIST: 4.0 A
Residues superimposed below 2.00 A: GREEN
Residues superimposed below 4.00 A: YELLOW
Residues superimposed below 6.00 A: ORANGE
Residues superimposed below 8.00 A: BROWN
Residues superimposed above 8.00 A or not aligned: RED
Terminal residues not aligned: GREY
Structure Deviation Summary
Calculations based on one final LGA superposition
(Bar representation of 3D plots, TEXT)
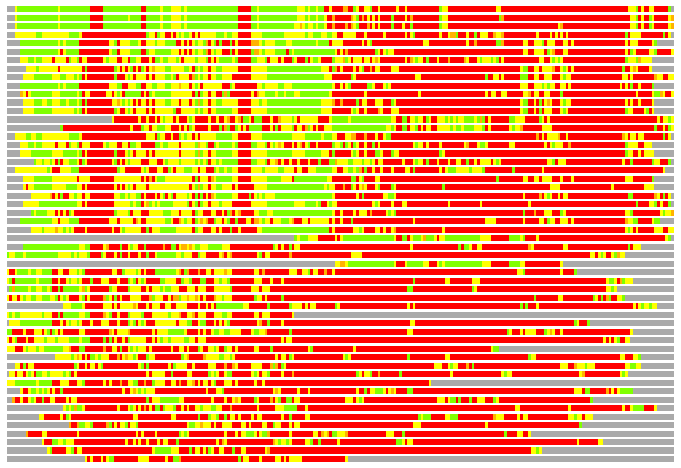
Structures ordered by LGA_S - score
| Structure |
NS |
NT |
N(dist=4.0) |
RMSD(N) |
Seq_ID(N) |
LGA_S |
LGA_Q |
PLOTS |
| 1a9x_A |
1058 |
248 |
127 |
1.85 |
15.75 |
44.640 |
6.503 |
T P |
| 1m6v_A |
1059 |
248 |
128 |
1.94 |
14.84 |
44.408 |
6.285 |
T P |
| 1c30_A |
1058 |
248 |
128 |
1.90 |
14.84 |
44.015 |
6.406 |
T P |
| 1iov_A |
306 |
248 |
121 |
2.64 |
12.40 |
32.785 |
4.420 |
T P |
| 2yw2_A |
423 |
248 |
118 |
2.55 |
8.47 |
32.472 |
4.454 |
T P |
| 2yrx_A |
420 |
248 |
115 |
2.40 |
6.96 |
31.990 |
4.608 |
T P |
| 1kjq_A |
388 |
248 |
131 |
2.69 |
13.74 |
31.845 |
4.701 |
T P |
| 2gps_A |
447 |
248 |
120 |
2.55 |
11.67 |
31.518 |
4.530 |
T P |
| 3g8c_A |
444 |
248 |
116 |
2.46 |
11.21 |
31.403 |
4.531 |
T P |
| 2qk4_B |
424 |
248 |
117 |
2.45 |
7.69 |
31.311 |
4.591 |
T P |
| 2vpq_B |
448 |
248 |
112 |
2.33 |
6.25 |
31.145 |
4.602 |
T P |
| 2gpw_D |
447 |
248 |
119 |
2.55 |
12.61 |
31.058 |
4.487 |
T P |
| 3g8d_B |
444 |
248 |
117 |
2.50 |
12.82 |
30.964 |
4.494 |
T P |
| 1w96_A |
549 |
248 |
107 |
2.46 |
9.35 |
30.659 |
4.183 |
T P |
| 1w93_A |
549 |
248 |
108 |
2.42 |
10.19 |
30.219 |
4.290 |
T P |
| 1iow_A |
306 |
248 |
109 |
2.57 |
11.01 |
30.085 |
4.089 |
T P |
| 1eyz_A |
389 |
248 |
119 |
2.62 |
12.61 |
29.754 |
4.379 |
T P |
| 1dv2_A |
450 |
248 |
112 |
2.48 |
12.50 |
29.490 |
4.334 |
T P |
| 2dwc_B |
409 |
248 |
120 |
2.66 |
9.17 |
29.381 |
4.346 |
T P |
| 2pvp_A |
329 |
248 |
112 |
2.66 |
11.61 |
29.348 |
4.062 |
T P |
| 2hjw_A |
494 |
248 |
114 |
2.60 |
9.65 |
29.206 |
4.218 |
T P |
| 2vqd_A |
447 |
248 |
111 |
2.52 |
9.01 |
29.198 |
4.232 |
T P |
| 3bg5_A |
1137 |
248 |
104 |
2.44 |
9.62 |
28.682 |
4.096 |
T P |
| 1dv1_A |
433 |
248 |
108 |
2.50 |
7.41 |
28.211 |
4.146 |
T P |
| 1ulz_A |
451 |
248 |
102 |
2.53 |
7.84 |
27.903 |
3.872 |
T P |
| 2ip4_A |
414 |
248 |
108 |
2.69 |
3.70 |
27.322 |
3.866 |
T P |
| 2dzd_A |
459 |
248 |
97 |
2.44 |
13.40 |
26.904 |
3.813 |
T P |
| 1wr2_A |
235 |
248 |
71 |
1.91 |
21.13 |
24.569 |
3.539 |
T P |
| 1p2e_A |
568 |
248 |
76 |
2.29 |
13.16 |
21.219 |
3.181 |
T P |
| 2zj8_A |
700 |
248 |
78 |
2.49 |
1.28 |
20.524 |
3.016 |
T P |
| 2cqy_A |
108 |
248 |
59 |
2.10 |
20.34 |
19.991 |
2.686 |
T P |
| 1p9r_A |
378 |
248 |
73 |
2.54 |
8.22 |
19.868 |
2.769 |
T P |
| 1hv8_A |
363 |
248 |
72 |
2.43 |
5.56 |
19.394 |
2.845 |
T P |
| 1xtj_A |
374 |
248 |
73 |
2.44 |
4.11 |
19.336 |
2.878 |
T P |
| 1wp9_A |
479 |
248 |
72 |
2.75 |
4.17 |
18.516 |
2.529 |
T P |
| 1zz1_A |
367 |
248 |
68 |
2.73 |
8.82 |
17.721 |
2.399 |
T P |
| 1t6n_A |
207 |
248 |
68 |
2.54 |
4.41 |
17.504 |
2.571 |
T P |
| 1xtk_A |
382 |
248 |
63 |
2.38 |
7.94 |
17.102 |
2.542 |
T P |
| 3ber_A |
220 |
248 |
67 |
2.72 |
5.97 |
16.870 |
2.375 |
T P |
| 2eyq_A |
1146 |
248 |
63 |
2.60 |
9.52 |
16.029 |
2.336 |
T P |
| 2z0m_A |
331 |
248 |
58 |
2.68 |
10.34 |
15.854 |
2.083 |
T P |
| 2vcg_D |
375 |
248 |
62 |
2.80 |
8.06 |
15.853 |
2.135 |
T P |
| 2fwr_A |
434 |
248 |
63 |
2.92 |
7.94 |
15.782 |
2.088 |
T P |
| 2i4i_A |
408 |
248 |
62 |
2.77 |
6.45 |
15.249 |
2.159 |
T P |
| 2fz4_A |
206 |
248 |
54 |
2.66 |
7.41 |
15.212 |
1.954 |
T P |
| 1gm5_A |
729 |
248 |
56 |
2.55 |
3.57 |
15.194 |
2.112 |
T P |
| 1xti_A |
381 |
248 |
58 |
2.65 |
12.07 |
14.895 |
2.111 |
T P |
| 2nr8_A |
308 |
248 |
55 |
2.63 |
7.27 |
14.645 |
2.016 |
T P |
| 1duw_A |
289 |
248 |
50 |
2.70 |
6.00 |
13.096 |
1.785 |
T P |
| 1ffy_A |
917 |
248 |
46 |
2.87 |
10.87 |
11.620 |
1.547 |
T P |
| 2d7i_A |
536 |
248 |
43 |
2.89 |
4.65 |
11.307 |
1.438 |
T P |
| 2i13_A |
151 |
248 |
40 |
2.88 |
7.50 |
10.873 |
1.344 |
T P |
| 1z5f_A |
105 |
248 |
34 |
2.60 |
2.94 |
9.106 |
1.259 |
T P |
| 1mey_F |
84 |
248 |
27 |
2.87 |
11.11 |
7.174 |
0.908 |
T P |
NS : Total number of residues in Structure (rotated structure)
NT : Total number of residues in TARGET (frame of reference)
N : Total number of residues superimposed under 4.0 Angstrom distance cutoff
RMSD : RMS deviation calculated on all N residues superimposed under 4.0 Angstrom distance cutoff
Seq_Id : Sequence Identity. Percent of identical residues from the total of N aligned.
LGA_S : Structure similarity score calculated by internal LGA procedure (see LGA paper for details)
LGA_Q : Score (how tight is the superposition) calculated by the formula: Q = 0.1*N/(0.1+RMSD)
PLOTS : T - Flat text file (output from LGA program, rotated structure)
PLOTS : P - Plot of superimposed structures (3D plot colored as bars)
Citing LGA:
Zemla A., "LGA - a Method for Finding 3D Similarities in Protein Structures",
Nucleic Acids Research, 2003, Vol. 31, No. 13, pp. 3370-3374.
[MEDLINE]