LGA
Sequence Independent Analysis (LGA)
Frame of reference: Cat.Q2246_545_55.5wLII_10954_22
Total number of 3D structures: 33
LGA calculations using distance cutoff DIST: 4.0 A
Residues superimposed below 2.00 A: GREEN
Residues superimposed below 4.00 A: YELLOW
Residues superimposed below 6.00 A: ORANGE
Residues superimposed below 8.00 A: BROWN
Residues superimposed above 8.00 A or not aligned: RED
Terminal residues not aligned: GREY
Structure Deviation Summary
Calculations based on one final LGA superposition
(Bar representation of 3D plots, TEXT)
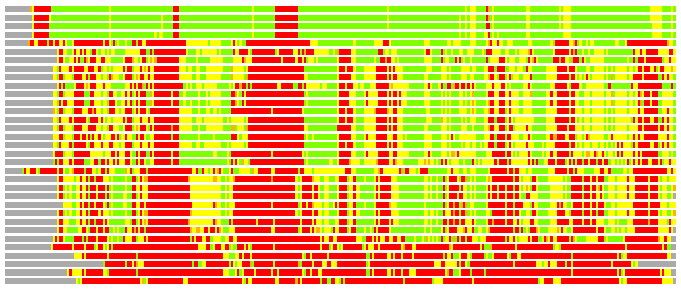
Structures ordered by LGA_S - score
| Structure |
NS |
NT |
N(dist=4.0) |
RMSD(N) |
Seq_ID(N) |
LGA_S |
LGA_Q |
PLOTS |
| 1uhv_A |
500 |
323 |
288 |
1.11 |
11.11 |
87.049 |
23.897 |
T P |
| 1w91_A |
499 |
323 |
288 |
1.13 |
10.42 |
86.649 |
23.380 |
T P |
| 2bs9_A |
501 |
323 |
287 |
1.08 |
10.45 |
86.585 |
24.228 |
T P |
| 2bfg_A |
501 |
323 |
288 |
1.17 |
10.07 |
86.116 |
22.611 |
T P |
| 2e4t_A |
509 |
323 |
197 |
2.17 |
9.64 |
43.640 |
8.673 |
T P |
| 1np2_A |
426 |
323 |
209 |
2.25 |
10.05 |
42.909 |
8.900 |
T P |
| 1kwg_A |
644 |
323 |
207 |
2.31 |
9.66 |
42.028 |
8.592 |
T P |
| 2dep_A |
340 |
323 |
208 |
2.46 |
8.65 |
39.363 |
8.136 |
T P |
| 2f8q_A |
353 |
323 |
201 |
2.42 |
9.45 |
39.353 |
7.985 |
T P |
| 1qnr_A |
344 |
323 |
191 |
2.32 |
9.42 |
39.325 |
7.909 |
T P |
| 2q8x_A |
330 |
323 |
204 |
2.44 |
9.80 |
39.203 |
8.026 |
T P |
| 1n82_A |
330 |
323 |
203 |
2.45 |
9.36 |
39.103 |
7.957 |
T P |
| 2uwf_A |
356 |
323 |
198 |
2.40 |
9.60 |
38.874 |
7.911 |
T P |
| 1r85_A |
371 |
323 |
202 |
2.48 |
9.90 |
38.746 |
7.837 |
T P |
| 2fgl_A |
354 |
323 |
200 |
2.46 |
9.50 |
38.466 |
7.821 |
T P |
| 1vbr_A |
324 |
323 |
198 |
2.45 |
9.09 |
38.312 |
7.750 |
T P |
| 1r86_A |
371 |
323 |
198 |
2.46 |
8.59 |
38.222 |
7.719 |
T P |
| 1nq6_A |
302 |
323 |
187 |
2.51 |
10.16 |
36.850 |
7.167 |
T P |
| 1ta3_B |
301 |
323 |
186 |
2.45 |
10.22 |
36.681 |
7.283 |
T P |
| 1nof_A |
383 |
323 |
188 |
2.45 |
9.04 |
36.602 |
7.374 |
T P |
| 1a3h_A |
300 |
323 |
178 |
2.52 |
7.30 |
34.214 |
6.784 |
T P |
| 2v38_A |
301 |
323 |
174 |
2.44 |
6.32 |
33.827 |
6.849 |
T P |
| 7a3h_A |
300 |
323 |
173 |
2.45 |
6.94 |
33.718 |
6.786 |
T P |
| 1egz_A |
291 |
323 |
166 |
2.44 |
8.43 |
33.470 |
6.525 |
T P |
| 1h5v_A |
301 |
323 |
171 |
2.48 |
6.43 |
33.150 |
6.624 |
T P |
| 1lf1_A |
296 |
323 |
168 |
2.50 |
9.52 |
33.070 |
6.468 |
T P |
| 1tvn_A |
293 |
323 |
158 |
2.44 |
10.13 |
32.450 |
6.216 |
T P |
| 1ccw_B |
483 |
323 |
136 |
2.55 |
12.50 |
26.872 |
5.138 |
T P |
| 2ber_A |
601 |
323 |
57 |
2.78 |
7.02 |
11.478 |
1.976 |
T P |
| 2bq9_A |
601 |
323 |
54 |
2.76 |
3.70 |
11.159 |
1.889 |
T P |
| 1eut_A |
601 |
323 |
58 |
2.82 |
8.62 |
11.045 |
1.985 |
T P |
| 1w8o_A |
601 |
323 |
54 |
2.85 |
3.70 |
10.446 |
1.828 |
T P |
| 1wcq_A |
601 |
323 |
47 |
2.60 |
6.38 |
9.277 |
1.738 |
T P |
NS : Total number of residues in Structure (rotated structure)
NT : Total number of residues in TARGET (frame of reference)
N : Total number of residues superimposed under 4.0 Angstrom distance cutoff
RMSD : RMS deviation calculated on all N residues superimposed under 4.0 Angstrom distance cutoff
Seq_Id : Sequence Identity. Percent of identical residues from the total of N aligned.
LGA_S : Structure similarity score calculated by internal LGA procedure (see LGA paper for details)
LGA_Q : Score (how tight is the superposition) calculated by the formula: Q = 0.1*N/(0.1+RMSD)
PLOTS : T - Flat text file (output from LGA program, rotated structure)
PLOTS : P - Plot of superimposed structures (3D plot colored as bars)
Citing LGA:
Zemla A., "LGA - a Method for Finding 3D Similarities in Protein Structures",
Nucleic Acids Research, 2003, Vol. 31, No. 13, pp. 3370-3374.
[MEDLINE]