LGA
Sequence Independent Analysis (LGA)
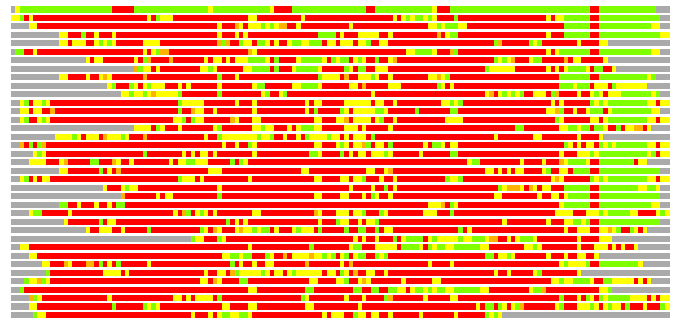
Frame of reference: Cat.Q2246_545_75.5wLII_10965_5
Total number of 3D structures: 37
LGA calculations using distance cutoff DIST: 4.0 A
Residues superimposed below 2.00 A: GREEN
Residues superimposed below 4.00 A: YELLOW
Residues superimposed below 6.00 A: ORANGE
Residues superimposed below 8.00 A: BROWN
Residues superimposed above 8.00 A or not aligned: RED
Terminal residues not aligned: GREY
Structure Deviation Summary
Calculations based on one final LGA superposition
(Bar representation of 3D plots, TEXT)

Structures ordered by LGA_S - score
| Structure |
NS |
NT |
N(dist=4.0) |
RMSD(N) |
Seq_ID(N) |
LGA_S |
LGA_Q |
PLOTS |
| 3d8d_A |
139 |
150 |
130 |
0.73 |
25.38 |
85.760 |
15.620 |
T P |
| 2nvw_A |
413 |
150 |
45 |
2.14 |
11.11 |
24.131 |
2.012 |
T P |
| 3e9m_A |
321 |
150 |
45 |
2.36 |
4.44 |
23.343 |
1.829 |
T P |
| 2o4u_X |
331 |
150 |
46 |
2.31 |
6.52 |
22.768 |
1.907 |
T P |
| 2ho5_A |
305 |
150 |
50 |
2.72 |
10.00 |
22.655 |
1.772 |
T P |
| 3e1k_A |
395 |
150 |
42 |
2.19 |
14.29 |
22.537 |
1.837 |
T P |
| 1ydw_B |
350 |
150 |
49 |
2.70 |
8.16 |
22.286 |
1.748 |
T P |
| 1lc0_A |
290 |
150 |
48 |
2.46 |
6.25 |
22.252 |
1.876 |
T P |
| 1gcu_A |
292 |
150 |
46 |
2.43 |
2.17 |
22.180 |
1.817 |
T P |
| 2ho3_D |
304 |
150 |
49 |
2.60 |
6.12 |
21.782 |
1.818 |
T P |
| 3ec7_A |
336 |
150 |
49 |
2.55 |
6.12 |
21.652 |
1.846 |
T P |
| 1h6d_A |
383 |
150 |
50 |
2.66 |
4.00 |
21.407 |
1.808 |
T P |
| 1zh8_A |
325 |
150 |
47 |
2.65 |
8.51 |
21.146 |
1.711 |
T P |
| 1ryd_A |
381 |
150 |
49 |
2.65 |
4.08 |
20.980 |
1.781 |
T P |
| 2h63_D |
285 |
150 |
44 |
2.69 |
2.27 |
20.941 |
1.578 |
T P |
| 3c1a_A |
307 |
150 |
50 |
2.81 |
8.00 |
20.699 |
1.716 |
T P |
| 1evj_A |
340 |
150 |
46 |
2.59 |
4.35 |
20.671 |
1.709 |
T P |
| 3btu_A |
392 |
150 |
46 |
2.48 |
13.04 |
20.638 |
1.785 |
T P |
| 1yrl_A |
487 |
150 |
44 |
2.47 |
6.82 |
20.430 |
1.709 |
T P |
| 3cea_A |
342 |
150 |
42 |
2.44 |
7.14 |
20.380 |
1.655 |
T P |
| 1ofg_A |
381 |
150 |
44 |
2.56 |
2.27 |
20.357 |
1.651 |
T P |
| 3ezy_A |
334 |
150 |
40 |
2.38 |
7.50 |
20.211 |
1.611 |
T P |
| 3fhl_C |
338 |
150 |
38 |
2.34 |
5.26 |
19.989 |
1.559 |
T P |
| 1xea_A |
311 |
150 |
34 |
1.97 |
2.94 |
19.585 |
1.639 |
T P |
| 3btv_B |
392 |
150 |
46 |
2.64 |
4.35 |
19.529 |
1.676 |
T P |
| 1tlt_B |
305 |
150 |
37 |
2.25 |
2.70 |
19.489 |
1.572 |
T P |
| 2p2s_A |
333 |
150 |
45 |
2.76 |
4.44 |
18.959 |
1.574 |
T P |
| 3e18_A |
348 |
150 |
40 |
2.49 |
5.00 |
18.900 |
1.546 |
T P |
| 3fd8_D |
349 |
150 |
42 |
2.55 |
4.76 |
18.823 |
1.584 |
T P |
| 3dty_A |
374 |
150 |
41 |
2.62 |
2.44 |
18.688 |
1.507 |
T P |
| 3evn_A |
316 |
150 |
37 |
2.63 |
5.41 |
18.565 |
1.355 |
T P |
| 3euw_A |
333 |
150 |
41 |
2.84 |
12.20 |
18.322 |
1.395 |
T P |
| 3e82_D |
350 |
150 |
42 |
2.82 |
9.52 |
18.191 |
1.437 |
T P |
| 3f4l_A |
344 |
150 |
38 |
2.32 |
5.26 |
17.905 |
1.568 |
T P |
| 2glx_A |
332 |
150 |
39 |
2.66 |
10.26 |
17.729 |
1.414 |
T P |
| 2ixa_A |
426 |
150 |
37 |
2.68 |
8.11 |
16.283 |
1.329 |
T P |
| 3db2_A |
347 |
150 |
29 |
2.65 |
10.34 |
13.582 |
1.053 |
T P |
NS : Total number of residues in Structure (rotated structure)
NT : Total number of residues in TARGET (frame of reference)
N : Total number of residues superimposed under 4.0 Angstrom distance cutoff
RMSD : RMS deviation calculated on all N residues superimposed under 4.0 Angstrom distance cutoff
Seq_Id : Sequence Identity. Percent of identical residues from the total of N aligned.
LGA_S : Structure similarity score calculated by internal LGA procedure (see LGA paper for details)
LGA_Q : Score (how tight is the superposition) calculated by the formula: Q = 0.1*N/(0.1+RMSD)
PLOTS : T - Flat text file (output from LGA program, rotated structure)
PLOTS : P - Plot of superimposed structures (3D plot colored as bars)
Citing LGA:
Zemla A., "LGA - a Method for Finding 3D Similarities in Protein Structures",
Nucleic Acids Research, 2003, Vol. 31, No. 13, pp. 3370-3374.
[MEDLINE]

