LGA
Sequence Independent Analysis (LGA)
Frame of reference: Cat.Q2246_545_77.5wLII_11067_14
Total number of 3D structures: 51
LGA calculations using distance cutoff DIST: 4.0 A
Residues superimposed below 2.00 A: GREEN
Residues superimposed below 4.00 A: YELLOW
Residues superimposed below 6.00 A: ORANGE
Residues superimposed below 8.00 A: BROWN
Residues superimposed above 8.00 A or not aligned: RED
Terminal residues not aligned: GREY
Structure Deviation Summary
Calculations based on one final LGA superposition
(Bar representation of 3D plots, TEXT)
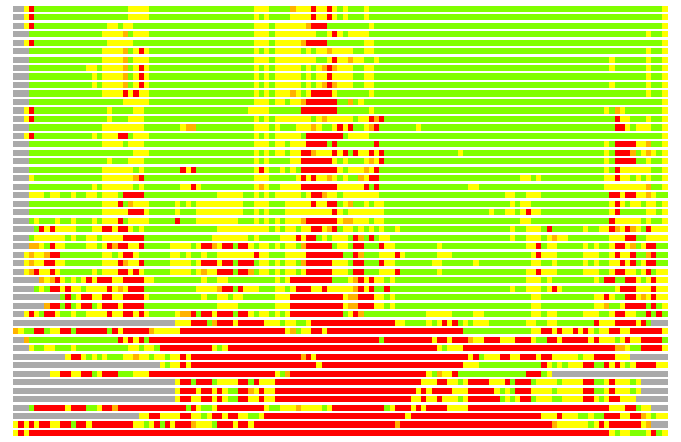
Structures ordered by LGA_S - score
| Structure |
NS |
NT |
N(dist=4.0) |
RMSD(N) |
Seq_ID(N) |
LGA_S |
LGA_Q |
PLOTS |
| 2geb_A |
184 |
125 |
120 |
1.36 |
13.33 |
91.021 |
8.245 |
T P |
| 1yfz_A |
178 |
125 |
120 |
1.38 |
13.33 |
90.926 |
8.135 |
T P |
| 1g9s_A |
169 |
125 |
119 |
1.36 |
15.13 |
90.712 |
8.168 |
T P |
| 1p18_B |
194 |
125 |
121 |
1.59 |
9.92 |
90.614 |
7.150 |
T P |
| 1j7j_B |
164 |
125 |
118 |
1.28 |
15.25 |
90.330 |
8.526 |
T P |
| 1i13_B |
193 |
125 |
121 |
1.69 |
9.09 |
90.277 |
6.765 |
T P |
| 1i0i_B |
194 |
125 |
121 |
1.61 |
8.26 |
90.186 |
7.062 |
T P |
| 1i0l_B |
194 |
125 |
120 |
1.67 |
9.17 |
89.618 |
6.786 |
T P |
| 1tc2_B |
196 |
125 |
120 |
1.67 |
10.00 |
89.435 |
6.798 |
T P |
| 1i14_B |
194 |
125 |
120 |
1.68 |
9.17 |
89.154 |
6.742 |
T P |
| 1tc1_B |
186 |
125 |
116 |
1.49 |
10.34 |
88.839 |
7.275 |
T P |
| 2ywu_A |
164 |
125 |
116 |
1.42 |
12.07 |
88.389 |
7.655 |
T P |
| 1hgx_A |
164 |
125 |
115 |
1.39 |
13.04 |
87.853 |
7.739 |
T P |
| 1fsg_A |
233 |
125 |
119 |
1.78 |
7.56 |
87.333 |
6.340 |
T P |
| 1d6n_A |
214 |
125 |
117 |
1.84 |
12.82 |
86.302 |
6.039 |
T P |
| 1pzm_A |
170 |
125 |
113 |
1.48 |
8.85 |
85.611 |
7.151 |
T P |
| 2jbh_B |
213 |
125 |
112 |
1.56 |
8.93 |
84.372 |
6.741 |
T P |
| 1dbr_A |
227 |
125 |
112 |
1.72 |
9.82 |
83.372 |
6.147 |
T P |
| 1qk5_B |
217 |
125 |
111 |
1.53 |
8.11 |
82.811 |
6.829 |
T P |
| 2vfa_B |
205 |
125 |
110 |
1.69 |
13.64 |
82.040 |
6.151 |
T P |
| 1cjb_C |
230 |
125 |
116 |
1.86 |
10.34 |
80.098 |
5.925 |
T P |
| 1z7g_C |
204 |
125 |
112 |
1.89 |
13.39 |
79.534 |
5.635 |
T P |
| 1vdm_G |
152 |
125 |
112 |
1.97 |
13.39 |
77.440 |
5.404 |
T P |
| 2igb_B |
173 |
125 |
117 |
1.94 |
8.55 |
77.382 |
5.738 |
T P |
| 1a3c_A |
166 |
125 |
116 |
2.01 |
9.48 |
72.304 |
5.486 |
T P |
| 1ufr_A |
167 |
125 |
113 |
2.07 |
8.85 |
70.849 |
5.218 |
T P |
| 1i5e_A |
208 |
125 |
108 |
2.19 |
4.63 |
64.134 |
4.714 |
T P |
| 2dy0_A |
182 |
125 |
111 |
2.23 |
8.11 |
63.789 |
4.772 |
T P |
| 2h08_B |
308 |
125 |
98 |
2.18 |
4.08 |
62.653 |
4.298 |
T P |
| 1dku_A |
295 |
125 |
105 |
2.20 |
5.71 |
62.497 |
4.557 |
T P |
| 2h06_B |
308 |
125 |
99 |
2.15 |
4.04 |
60.797 |
4.409 |
T P |
| 2h07_B |
308 |
125 |
101 |
2.22 |
4.95 |
60.341 |
4.360 |
T P |
| 1ecf_B |
500 |
125 |
96 |
2.06 |
7.29 |
58.516 |
4.449 |
T P |
| 1zn8_B |
179 |
125 |
99 |
2.15 |
9.09 |
57.834 |
4.397 |
T P |
| 1ao0_A |
455 |
125 |
90 |
1.99 |
7.78 |
55.736 |
4.298 |
T P |
| 1gph_1 |
465 |
125 |
89 |
1.92 |
6.74 |
55.711 |
4.404 |
T P |
| 3dah_C |
300 |
125 |
93 |
2.25 |
8.60 |
55.594 |
3.961 |
T P |
| 1lrz_A |
400 |
125 |
56 |
2.34 |
5.36 |
31.928 |
2.299 |
T P |
| 2hko_A |
647 |
125 |
48 |
2.50 |
6.25 |
26.365 |
1.847 |
T P |
| 1wgz_A |
510 |
125 |
43 |
2.24 |
6.98 |
25.929 |
1.836 |
T P |
| 3dwc_B |
504 |
125 |
39 |
2.27 |
7.69 |
24.386 |
1.645 |
T P |
| 2h94_A |
647 |
125 |
42 |
2.76 |
2.38 |
22.157 |
1.469 |
T P |
| 1bg1_A |
559 |
125 |
36 |
2.34 |
5.56 |
21.273 |
1.474 |
T P |
| 1r62_A |
136 |
125 |
35 |
2.14 |
8.57 |
21.138 |
1.563 |
T P |
| 2z3y_A |
643 |
125 |
40 |
2.60 |
17.50 |
20.473 |
1.480 |
T P |
| 2iw5_A |
666 |
125 |
37 |
2.75 |
16.22 |
20.034 |
1.297 |
T P |
| 2dw4_A |
634 |
125 |
40 |
2.82 |
12.50 |
19.921 |
1.370 |
T P |
| 2v1d_A |
666 |
125 |
38 |
2.69 |
2.63 |
19.673 |
1.364 |
T P |
| 3cwg_B |
507 |
125 |
35 |
2.75 |
5.71 |
18.533 |
1.229 |
T P |
| 1ka2_A |
497 |
125 |
33 |
2.96 |
3.03 |
17.831 |
1.080 |
T P |
| 2e57_A |
606 |
125 |
12 |
2.24 |
0.00 |
7.822 |
0.513 |
T P |
NS : Total number of residues in Structure (rotated structure)
NT : Total number of residues in TARGET (frame of reference)
N : Total number of residues superimposed under 4.0 Angstrom distance cutoff
RMSD : RMS deviation calculated on all N residues superimposed under 4.0 Angstrom distance cutoff
Seq_Id : Sequence Identity. Percent of identical residues from the total of N aligned.
LGA_S : Structure similarity score calculated by internal LGA procedure (see LGA paper for details)
LGA_Q : Score (how tight is the superposition) calculated by the formula: Q = 0.1*N/(0.1+RMSD)
PLOTS : T - Flat text file (output from LGA program, rotated structure)
PLOTS : P - Plot of superimposed structures (3D plot colored as bars)
Citing LGA:
Zemla A., "LGA - a Method for Finding 3D Similarities in Protein Structures",
Nucleic Acids Research, 2003, Vol. 31, No. 13, pp. 3370-3374.
[MEDLINE]