LGA
Sequence Independent Analysis (LGA)
Frame of reference: Cat.Q2246_545_82.5wLII_11067_33
Total number of 3D structures: 60
LGA calculations using distance cutoff DIST: 4.0 A
Residues superimposed below 2.00 A: GREEN
Residues superimposed below 4.00 A: YELLOW
Residues superimposed below 6.00 A: ORANGE
Residues superimposed below 8.00 A: BROWN
Residues superimposed above 8.00 A or not aligned: RED
Terminal residues not aligned: GREY
Structure Deviation Summary
Calculations based on one final LGA superposition
(Bar representation of 3D plots, TEXT)
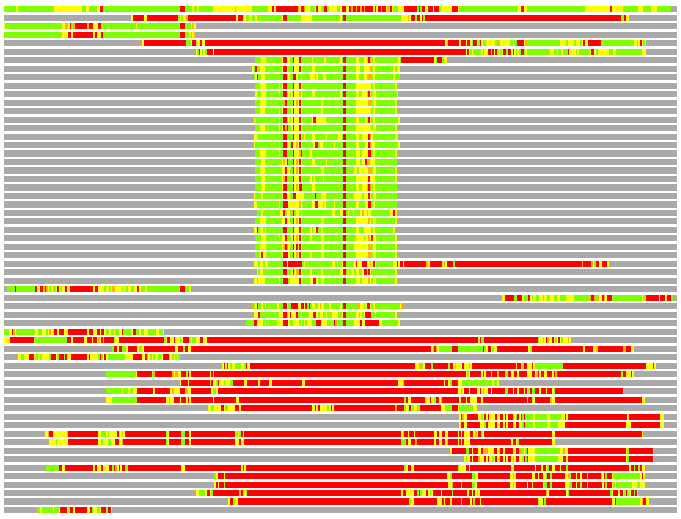
Structures ordered by LGA_S - score
| Structure |
NS |
NT |
N(dist=4.0) |
RMSD(N) |
Seq_ID(N) |
LGA_S |
LGA_Q |
PLOTS |
| 1w26_A |
432 |
428 |
356 |
2.02 |
14.33 |
64.180 |
16.760 |
T P |
| 1t11_A |
376 |
428 |
120 |
1.68 |
11.67 |
26.015 |
6.755 |
T P |
| 1oms_C |
118 |
428 |
105 |
1.53 |
17.14 |
23.737 |
6.453 |
T P |
| 1p9y_A |
117 |
428 |
102 |
1.41 |
18.63 |
23.308 |
6.739 |
T P |
| 1zxj_D |
193 |
428 |
109 |
2.19 |
19.27 |
19.758 |
4.765 |
T P |
| 2nsa_A |
167 |
428 |
107 |
2.08 |
14.02 |
19.403 |
4.916 |
T P |
| 1q1c_A |
237 |
428 |
91 |
1.81 |
10.99 |
18.932 |
4.765 |
T P |
| 2vn1_B |
123 |
428 |
87 |
1.84 |
9.20 |
18.308 |
4.473 |
T P |
| 1n1a_A |
121 |
428 |
86 |
1.74 |
11.63 |
18.138 |
4.665 |
T P |
| 2ppn_A |
107 |
428 |
84 |
1.78 |
10.71 |
18.021 |
4.478 |
T P |
| 1r9h_A |
118 |
428 |
85 |
1.84 |
8.24 |
18.003 |
4.391 |
T P |
| 1bkf_A |
107 |
428 |
85 |
1.87 |
10.59 |
18.001 |
4.311 |
T P |
| 2ppp_A |
107 |
428 |
84 |
1.76 |
10.71 |
17.966 |
4.523 |
T P |
| 1fd9_A |
204 |
428 |
84 |
1.72 |
9.52 |
17.948 |
4.621 |
T P |
| 2ppo_A |
107 |
428 |
84 |
1.83 |
10.71 |
17.892 |
4.358 |
T P |
| 2pbc_A |
100 |
428 |
85 |
1.80 |
20.00 |
17.883 |
4.467 |
T P |
| 1q6u_A |
213 |
428 |
84 |
1.79 |
13.10 |
17.843 |
4.439 |
T P |
| 1bl4_A |
107 |
428 |
82 |
1.72 |
9.76 |
17.795 |
4.497 |
T P |
| 1yat_A |
113 |
428 |
84 |
1.86 |
10.71 |
17.762 |
4.294 |
T P |
| 2dg4_A |
107 |
428 |
85 |
1.93 |
11.76 |
17.692 |
4.179 |
T P |
| 1tco_C |
107 |
428 |
84 |
1.84 |
9.52 |
17.614 |
4.336 |
T P |
| 1pbk_A |
116 |
428 |
82 |
1.75 |
17.07 |
17.522 |
4.438 |
T P |
| 1rot_A |
118 |
428 |
83 |
1.78 |
12.05 |
17.483 |
4.414 |
T P |
| 1q6h_A |
210 |
428 |
82 |
1.81 |
13.41 |
17.462 |
4.303 |
T P |
| 1hxv_A |
85 |
428 |
84 |
1.85 |
11.90 |
17.442 |
4.297 |
T P |
| 2dg9_A |
107 |
428 |
85 |
1.94 |
10.59 |
17.407 |
4.161 |
T P |
| 1u79_A |
125 |
428 |
82 |
1.81 |
13.41 |
17.404 |
4.302 |
T P |
| 1eym_A |
107 |
428 |
84 |
1.89 |
9.52 |
17.371 |
4.213 |
T P |
| 1fkl_A |
107 |
428 |
84 |
1.93 |
10.71 |
17.285 |
4.147 |
T P |
| 1c9h_A |
107 |
428 |
82 |
1.85 |
12.20 |
17.201 |
4.199 |
T P |
| 1kt1_A |
374 |
428 |
88 |
2.25 |
14.77 |
17.135 |
3.737 |
T P |
| 1ix5_A |
151 |
428 |
80 |
1.78 |
12.50 |
15.855 |
4.253 |
T P |
| 1jvw_A |
160 |
428 |
84 |
2.05 |
15.48 |
15.548 |
3.912 |
T P |
| 2aar_7 |
113 |
428 |
89 |
2.24 |
15.73 |
15.116 |
3.807 |
T P |
| 1m5y_D |
389 |
428 |
79 |
2.16 |
6.33 |
14.313 |
3.491 |
T P |
| 2ofn_A |
135 |
428 |
81 |
2.11 |
8.64 |
14.175 |
3.668 |
T P |
| 2uz5_A |
137 |
428 |
78 |
2.01 |
10.26 |
14.066 |
3.693 |
T P |
| 1l1p_A |
106 |
428 |
77 |
2.17 |
11.69 |
12.720 |
3.396 |
T P |
| 2nsc_A |
109 |
428 |
74 |
2.26 |
14.86 |
12.382 |
3.138 |
T P |
| 1jqo_A |
904 |
428 |
75 |
2.60 |
10.67 |
11.727 |
2.782 |
T P |
| 1vdk_A |
458 |
428 |
59 |
2.36 |
11.86 |
10.979 |
2.402 |
T P |
| 2d3o_1 |
100 |
428 |
69 |
2.43 |
8.70 |
10.845 |
2.722 |
T P |
| 1qvr_A |
803 |
428 |
64 |
2.43 |
9.38 |
10.230 |
2.527 |
T P |
| 2h94_A |
647 |
428 |
59 |
2.60 |
11.86 |
9.829 |
2.189 |
T P |
| 2pv3_A |
284 |
428 |
55 |
2.27 |
10.91 |
9.762 |
2.316 |
T P |
| 2z3y_A |
643 |
428 |
61 |
2.58 |
8.20 |
9.688 |
2.280 |
T P |
| 2dw4_A |
634 |
428 |
57 |
2.52 |
5.26 |
9.325 |
2.177 |
T P |
| 1pjh_B |
260 |
428 |
57 |
2.59 |
10.53 |
9.090 |
2.116 |
T P |
| 1tya_E |
317 |
428 |
51 |
2.38 |
13.73 |
8.947 |
2.052 |
T P |
| 1tyc_A |
317 |
428 |
51 |
2.36 |
11.76 |
8.934 |
2.072 |
T P |
| 2iw5_A |
666 |
428 |
63 |
2.95 |
3.17 |
8.792 |
2.069 |
T P |
| 2v1d_A |
666 |
428 |
58 |
2.86 |
5.17 |
8.761 |
1.960 |
T P |
| 1tyd_E |
317 |
428 |
51 |
2.56 |
13.73 |
8.674 |
1.917 |
T P |
| 1tyb_E |
317 |
428 |
51 |
2.57 |
13.73 |
8.655 |
1.911 |
T P |
| 2hko_A |
647 |
428 |
53 |
2.56 |
3.77 |
8.578 |
1.994 |
T P |
| 4ts1_A |
317 |
428 |
51 |
2.44 |
5.88 |
8.574 |
2.006 |
T P |
| 2ts1_A |
317 |
428 |
51 |
2.53 |
3.92 |
8.465 |
1.936 |
T P |
| 1pmi_A |
440 |
428 |
47 |
2.65 |
2.13 |
7.385 |
1.707 |
T P |
| 1q2l_A |
937 |
428 |
41 |
2.27 |
7.32 |
7.012 |
1.730 |
T P |
| 1w2b_5 |
35 |
428 |
28 |
1.96 |
14.29 |
5.008 |
1.362 |
T P |
NS : Total number of residues in Structure (rotated structure)
NT : Total number of residues in TARGET (frame of reference)
N : Total number of residues superimposed under 4.0 Angstrom distance cutoff
RMSD : RMS deviation calculated on all N residues superimposed under 4.0 Angstrom distance cutoff
Seq_Id : Sequence Identity. Percent of identical residues from the total of N aligned.
LGA_S : Structure similarity score calculated by internal LGA procedure (see LGA paper for details)
LGA_Q : Score (how tight is the superposition) calculated by the formula: Q = 0.1*N/(0.1+RMSD)
PLOTS : T - Flat text file (output from LGA program, rotated structure)
PLOTS : P - Plot of superimposed structures (3D plot colored as bars)
Citing LGA:
Zemla A., "LGA - a Method for Finding 3D Similarities in Protein Structures",
Nucleic Acids Research, 2003, Vol. 31, No. 13, pp. 3370-3374.
[MEDLINE]