LGA
Sequence Independent Analysis (LGA)
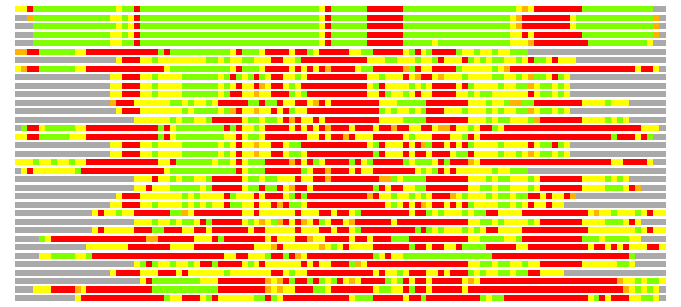
Frame of reference: Cat.Q2246_545_84.5wLII_11067_41
Total number of 3D structures: 35
LGA calculations using distance cutoff DIST: 4.0 A
Residues superimposed below 2.00 A: GREEN
Residues superimposed below 4.00 A: YELLOW
Residues superimposed below 6.00 A: ORANGE
Residues superimposed below 8.00 A: BROWN
Residues superimposed above 8.00 A or not aligned: RED
Terminal residues not aligned: GREY
Structure Deviation Summary
Calculations based on one final LGA superposition
(Bar representation of 3D plots, TEXT)

Structures ordered by LGA_S - score
| Structure |
NS |
NT |
N(dist=4.0) |
RMSD(N) |
Seq_ID(N) |
LGA_S |
LGA_Q |
PLOTS |
| 1crz_A |
403 |
109 |
90 |
1.08 |
13.33 |
81.575 |
7.596 |
T P |
| 2hqs_A |
412 |
109 |
90 |
1.24 |
13.33 |
79.901 |
6.708 |
T P |
| 2w8b_A |
409 |
109 |
89 |
1.13 |
13.48 |
79.285 |
7.220 |
T P |
| 2w8b_B |
409 |
109 |
88 |
1.11 |
13.64 |
78.851 |
7.264 |
T P |
| 1c5k_A |
397 |
109 |
87 |
1.16 |
13.79 |
77.768 |
6.890 |
T P |
| 5eaa_A |
396 |
109 |
49 |
2.18 |
18.37 |
33.698 |
2.147 |
T P |
| 1g4v_A |
396 |
109 |
57 |
2.60 |
8.77 |
33.461 |
2.110 |
T P |
| 2d66_A |
396 |
109 |
48 |
2.42 |
18.75 |
32.689 |
1.904 |
T P |
| 1tok_A |
395 |
109 |
56 |
2.64 |
1.79 |
32.242 |
2.047 |
T P |
| 2q7w_A |
378 |
109 |
53 |
2.57 |
9.43 |
31.941 |
1.984 |
T P |
| 1aia_A |
396 |
109 |
52 |
2.49 |
5.77 |
31.237 |
2.005 |
T P |
| 1ari_A |
396 |
109 |
51 |
2.63 |
11.76 |
31.183 |
1.871 |
T P |
| 1bqa_A |
395 |
109 |
55 |
2.69 |
3.64 |
31.124 |
1.970 |
T P |
| 2d61_A |
396 |
109 |
52 |
2.50 |
9.62 |
31.025 |
1.997 |
T P |
| 2aat_A |
396 |
109 |
45 |
2.43 |
13.33 |
30.641 |
1.779 |
T P |
| 1arh_A |
396 |
109 |
45 |
2.44 |
11.11 |
30.613 |
1.773 |
T P |
| 1ix6_A |
396 |
109 |
51 |
2.68 |
9.80 |
30.600 |
1.837 |
T P |
| 1tog_A |
395 |
109 |
52 |
2.65 |
5.77 |
30.470 |
1.893 |
T P |
| 1bqd_A |
395 |
109 |
47 |
2.48 |
8.51 |
30.307 |
1.819 |
T P |
| 1asf_A |
396 |
109 |
48 |
2.45 |
14.58 |
30.177 |
1.880 |
T P |
| 1spa_A |
396 |
109 |
52 |
2.62 |
9.62 |
29.810 |
1.911 |
T P |
| 1ars_A |
396 |
109 |
47 |
2.44 |
12.77 |
29.743 |
1.853 |
T P |
| 1ahx_A |
396 |
109 |
50 |
2.69 |
4.00 |
29.729 |
1.790 |
T P |
| 1qit_A |
396 |
109 |
48 |
2.75 |
10.42 |
29.437 |
1.687 |
T P |
| 1h4i_A |
595 |
109 |
51 |
2.88 |
1.96 |
28.940 |
1.710 |
T P |
| 1ix8_A |
396 |
109 |
48 |
2.73 |
10.42 |
28.481 |
1.697 |
T P |
| 1h4j_A |
595 |
109 |
50 |
2.89 |
2.00 |
28.376 |
1.673 |
T P |
| 1qir_A |
396 |
109 |
39 |
2.57 |
5.13 |
27.985 |
1.461 |
T P |
| 1w6s_C |
596 |
109 |
46 |
2.85 |
0.00 |
27.324 |
1.559 |
T P |
| 2yx6_C |
112 |
109 |
38 |
2.22 |
13.16 |
27.288 |
1.638 |
T P |
| 1aam_A |
396 |
109 |
47 |
2.62 |
8.51 |
27.184 |
1.728 |
T P |
| 1g4x_A |
396 |
109 |
45 |
2.80 |
11.11 |
26.308 |
1.552 |
T P |
| 1toi_A |
395 |
109 |
39 |
2.70 |
7.69 |
24.309 |
1.393 |
T P |
| 1qis_A |
396 |
109 |
38 |
2.58 |
2.63 |
23.624 |
1.418 |
T P |
| 1qcx_A |
359 |
109 |
34 |
2.50 |
5.88 |
21.579 |
1.308 |
T P |
NS : Total number of residues in Structure (rotated structure)
NT : Total number of residues in TARGET (frame of reference)
N : Total number of residues superimposed under 4.0 Angstrom distance cutoff
RMSD : RMS deviation calculated on all N residues superimposed under 4.0 Angstrom distance cutoff
Seq_Id : Sequence Identity. Percent of identical residues from the total of N aligned.
LGA_S : Structure similarity score calculated by internal LGA procedure (see LGA paper for details)
LGA_Q : Score (how tight is the superposition) calculated by the formula: Q = 0.1*N/(0.1+RMSD)
PLOTS : T - Flat text file (output from LGA program, rotated structure)
PLOTS : P - Plot of superimposed structures (3D plot colored as bars)
Citing LGA:
Zemla A., "LGA - a Method for Finding 3D Similarities in Protein Structures",
Nucleic Acids Research, 2003, Vol. 31, No. 13, pp. 3370-3374.
[MEDLINE]

