LGA
Sequence Independent Analysis (LGA)
Frame of reference: Cat.Q2246_545_90.5wLII_11068_11
Total number of 3D structures: 14
LGA calculations using distance cutoff DIST: 4.0 A
Residues superimposed below 2.00 A: GREEN
Residues superimposed below 4.00 A: YELLOW
Residues superimposed below 6.00 A: ORANGE
Residues superimposed below 8.00 A: BROWN
Residues superimposed above 8.00 A or not aligned: RED
Terminal residues not aligned: GREY
Structure Deviation Summary
Calculations based on one final LGA superposition
(Bar representation of 3D plots, TEXT)
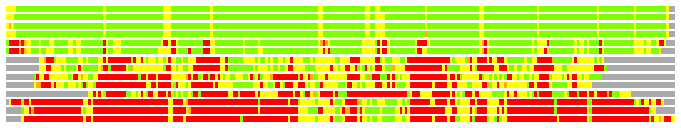
Structures ordered by LGA_S - score
| Structure |
NS |
NT |
N(dist=4.0) |
RMSD(N) |
Seq_ID(N) |
LGA_S |
LGA_Q |
PLOTS |
| 1k87_A |
514 |
268 |
266 |
1.07 |
23.31 |
96.413 |
22.765 |
T P |
| 3e2q_A |
469 |
268 |
266 |
1.08 |
22.93 |
96.231 |
22.492 |
T P |
| 1tj2_A |
450 |
268 |
266 |
1.09 |
23.31 |
96.144 |
22.314 |
T P |
| 1tiw_A |
459 |
268 |
266 |
1.10 |
23.31 |
96.126 |
22.232 |
T P |
| 2g37_B |
300 |
268 |
239 |
1.75 |
33.89 |
82.822 |
12.906 |
T P |
| 2ekg_B |
298 |
268 |
241 |
1.75 |
33.20 |
82.304 |
13.012 |
T P |
| 1a3h_A |
300 |
268 |
160 |
2.49 |
10.00 |
36.800 |
6.186 |
T P |
| 1tvn_A |
293 |
268 |
154 |
2.47 |
7.79 |
36.326 |
5.998 |
T P |
| 1k77_A |
260 |
268 |
136 |
2.65 |
5.88 |
30.505 |
4.940 |
T P |
| 3dx5_A |
274 |
268 |
135 |
2.66 |
9.63 |
29.592 |
4.885 |
T P |
| 2dp3_A |
255 |
268 |
102 |
2.58 |
9.80 |
24.457 |
3.810 |
T P |
| 2fm1_D |
344 |
268 |
78 |
2.69 |
7.69 |
18.030 |
2.796 |
T P |
| 1jg8_D |
343 |
268 |
72 |
2.60 |
6.94 |
17.647 |
2.662 |
T P |
| 1lw4_D |
343 |
268 |
71 |
2.71 |
7.04 |
17.085 |
2.530 |
T P |
NS : Total number of residues in Structure (rotated structure)
NT : Total number of residues in TARGET (frame of reference)
N : Total number of residues superimposed under 4.0 Angstrom distance cutoff
RMSD : RMS deviation calculated on all N residues superimposed under 4.0 Angstrom distance cutoff
Seq_Id : Sequence Identity. Percent of identical residues from the total of N aligned.
LGA_S : Structure similarity score calculated by internal LGA procedure (see LGA paper for details)
LGA_Q : Score (how tight is the superposition) calculated by the formula: Q = 0.1*N/(0.1+RMSD)
PLOTS : T - Flat text file (output from LGA program, rotated structure)
PLOTS : P - Plot of superimposed structures (3D plot colored as bars)
Citing LGA:
Zemla A., "LGA - a Method for Finding 3D Similarities in Protein Structures",
Nucleic Acids Research, 2003, Vol. 31, No. 13, pp. 3370-3374.
[MEDLINE]