LGA
Sequence Independent Analysis (LGA)
Frame of reference: Cat.Q2246_545_93.5wLII_11068_42
Total number of 3D structures: 57
LGA calculations using distance cutoff DIST: 4.0 A
Residues superimposed below 2.00 A: GREEN
Residues superimposed below 4.00 A: YELLOW
Residues superimposed below 6.00 A: ORANGE
Residues superimposed below 8.00 A: BROWN
Residues superimposed above 8.00 A or not aligned: RED
Terminal residues not aligned: GREY
Structure Deviation Summary
Calculations based on one final LGA superposition
(Bar representation of 3D plots, TEXT)
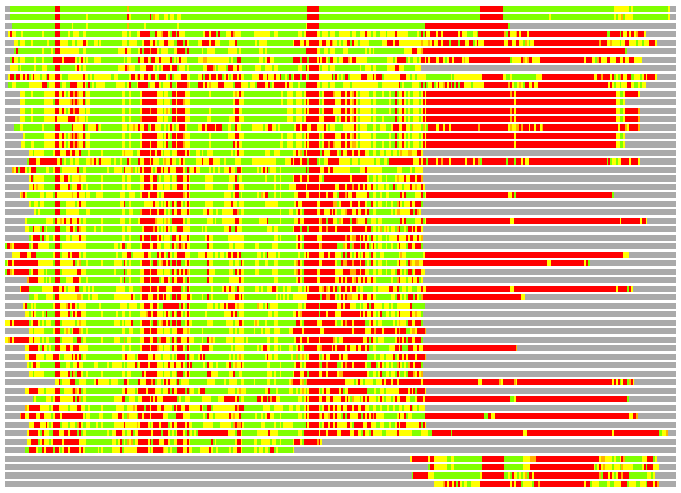
Structures ordered by LGA_S - score
| Structure |
NS |
NT |
N(dist=4.0) |
RMSD(N) |
Seq_ID(N) |
LGA_S |
LGA_Q |
PLOTS |
| 1xxi_C |
366 |
361 |
334 |
0.88 |
19.76 |
90.845 |
34.120 |
T P |
| 1jr3_A |
366 |
361 |
332 |
1.09 |
19.58 |
88.870 |
27.961 |
T P |
| 1njg_A |
240 |
361 |
214 |
1.09 |
21.50 |
57.035 |
17.912 |
T P |
| 1iqp_A |
326 |
361 |
223 |
2.32 |
18.39 |
42.885 |
9.227 |
T P |
| 2chq_A |
313 |
361 |
230 |
2.44 |
16.52 |
41.465 |
9.038 |
T P |
| 1sxj_E |
317 |
361 |
195 |
1.94 |
15.38 |
41.402 |
9.540 |
T P |
| 1sxj_A |
441 |
361 |
214 |
2.42 |
14.49 |
40.069 |
8.502 |
T P |
| 2chg_A |
223 |
361 |
190 |
2.03 |
20.53 |
38.844 |
8.941 |
T P |
| 1sxj_C |
322 |
361 |
226 |
2.57 |
9.73 |
38.743 |
8.452 |
T P |
| 1sxj_B |
316 |
361 |
220 |
2.54 |
12.73 |
37.786 |
8.340 |
T P |
| 1in8_A |
298 |
361 |
185 |
2.20 |
20.00 |
37.319 |
8.059 |
T P |
| 1in6_A |
300 |
361 |
185 |
2.21 |
19.46 |
37.251 |
8.024 |
T P |
| 1in5_A |
301 |
361 |
186 |
2.21 |
20.43 |
36.928 |
8.052 |
T P |
| 1in4_A |
298 |
361 |
185 |
2.22 |
20.54 |
36.880 |
7.973 |
T P |
| 1sxj_D |
328 |
361 |
201 |
2.52 |
12.94 |
36.757 |
7.675 |
T P |
| 1j7k_A |
299 |
361 |
181 |
2.22 |
20.99 |
36.058 |
7.811 |
T P |
| 1in7_A |
298 |
361 |
185 |
2.23 |
19.46 |
35.248 |
7.924 |
T P |
| 1iy2_A |
245 |
361 |
164 |
2.28 |
13.41 |
33.269 |
6.890 |
T P |
| 1xxh_E |
334 |
361 |
177 |
2.49 |
15.82 |
33.174 |
6.825 |
T P |
| 2v1u_A |
382 |
361 |
177 |
2.32 |
19.21 |
32.702 |
7.305 |
T P |
| 3eie_A |
303 |
361 |
157 |
2.22 |
15.29 |
32.595 |
6.779 |
T P |
| 3b9p_A |
268 |
361 |
161 |
2.35 |
14.91 |
32.586 |
6.563 |
T P |
| 1hqc_A |
314 |
361 |
173 |
2.33 |
20.81 |
32.543 |
7.106 |
T P |
| 3eih_A |
319 |
361 |
167 |
2.26 |
15.57 |
32.539 |
7.064 |
T P |
| 3d8b_A |
281 |
361 |
166 |
2.24 |
14.46 |
32.388 |
7.092 |
T P |
| 1ixs_B |
315 |
361 |
176 |
2.25 |
19.89 |
32.256 |
7.480 |
T P |
| 2rko_A |
280 |
361 |
155 |
2.19 |
14.19 |
32.137 |
6.756 |
T P |
| 3cf0_A |
281 |
361 |
158 |
2.28 |
12.66 |
31.873 |
6.652 |
T P |
| 1s3s_F |
441 |
361 |
165 |
2.27 |
13.94 |
31.650 |
6.959 |
T P |
| 2qby_A |
366 |
361 |
174 |
2.32 |
17.82 |
31.336 |
7.187 |
T P |
| 3cf2_A |
659 |
361 |
165 |
2.32 |
12.73 |
31.230 |
6.824 |
T P |
| 1r7r_A |
683 |
361 |
163 |
2.27 |
14.11 |
31.005 |
6.863 |
T P |
| 2ce7_C |
421 |
361 |
157 |
2.17 |
14.65 |
30.877 |
6.923 |
T P |
| 1ixr_C |
308 |
361 |
172 |
2.40 |
19.77 |
30.833 |
6.874 |
T P |
| 2dhr_A |
458 |
361 |
169 |
2.48 |
15.98 |
30.675 |
6.551 |
T P |
| 2c9o_A |
398 |
361 |
163 |
2.24 |
14.72 |
30.604 |
6.962 |
T P |
| 2qp9_X |
288 |
361 |
161 |
2.29 |
15.53 |
30.586 |
6.744 |
T P |
| 1ypw_A |
692 |
361 |
161 |
2.28 |
13.04 |
30.572 |
6.754 |
T P |
| 1ixz_A |
238 |
361 |
145 |
2.27 |
14.48 |
30.212 |
6.115 |
T P |
| 1yqi_C |
708 |
361 |
159 |
2.28 |
13.84 |
30.069 |
6.670 |
T P |
| 2qz4_A |
223 |
361 |
152 |
2.31 |
15.79 |
29.638 |
6.311 |
T P |
| 1d2n_A |
246 |
361 |
157 |
2.31 |
14.65 |
29.362 |
6.503 |
T P |
| 2zan_A |
312 |
361 |
154 |
2.31 |
16.88 |
29.268 |
6.390 |
T P |
| 1xwi_A |
322 |
361 |
155 |
2.19 |
14.84 |
29.179 |
6.765 |
T P |
| 2gno_A |
296 |
361 |
153 |
2.41 |
15.03 |
29.173 |
6.104 |
T P |
| 1nsf_A |
247 |
361 |
153 |
2.30 |
15.69 |
28.705 |
6.371 |
T P |
| 1ofh_A |
309 |
361 |
157 |
2.34 |
17.20 |
28.544 |
6.435 |
T P |
| 1lv7_A |
251 |
361 |
161 |
2.41 |
13.66 |
28.494 |
6.405 |
T P |
| 1r6b_X |
704 |
361 |
160 |
2.43 |
11.25 |
28.226 |
6.332 |
T P |
| 2r62_A |
249 |
361 |
159 |
2.49 |
15.09 |
28.060 |
6.150 |
T P |
| 1qvr_A |
803 |
361 |
144 |
2.44 |
17.36 |
25.509 |
5.676 |
T P |
| 1jbk_A |
189 |
361 |
111 |
2.24 |
19.82 |
22.245 |
4.742 |
T P |
| 2p65_A |
185 |
361 |
105 |
2.23 |
20.95 |
20.056 |
4.509 |
T P |
| 3bge_A |
163 |
361 |
72 |
2.35 |
4.17 |
15.142 |
2.939 |
T P |
| 3ctd_B |
158 |
361 |
71 |
2.29 |
2.82 |
14.717 |
2.967 |
T P |
| 2r9g_L |
188 |
361 |
64 |
1.92 |
4.69 |
14.091 |
3.171 |
T P |
| 2qw6_D |
86 |
361 |
61 |
2.65 |
8.20 |
11.158 |
2.222 |
T P |
NS : Total number of residues in Structure (rotated structure)
NT : Total number of residues in TARGET (frame of reference)
N : Total number of residues superimposed under 4.0 Angstrom distance cutoff
RMSD : RMS deviation calculated on all N residues superimposed under 4.0 Angstrom distance cutoff
Seq_Id : Sequence Identity. Percent of identical residues from the total of N aligned.
LGA_S : Structure similarity score calculated by internal LGA procedure (see LGA paper for details)
LGA_Q : Score (how tight is the superposition) calculated by the formula: Q = 0.1*N/(0.1+RMSD)
PLOTS : T - Flat text file (output from LGA program, rotated structure)
PLOTS : P - Plot of superimposed structures (3D plot colored as bars)
Citing LGA:
Zemla A., "LGA - a Method for Finding 3D Similarities in Protein Structures",
Nucleic Acids Research, 2003, Vol. 31, No. 13, pp. 3370-3374.
[MEDLINE]